Intention of Publication
This publication is for those interested in calibrating center pivot irrigation systems used for applying wastewater by:
- Providing step-by-step instructions on how to calibrate a center pivot irrigation system applying wastewater;
- Providing worksheets to help collect all information needed for calibrating the center pivot system; and
- Providing worksheets to help collect data and calculate “Application Uniformity.”
This publication is designed only as a guide and an aid in the calibration of a center pivot irrigation system to apply wastewater. The publication will not discuss in detail site location, environmental concerns, plant requirements, or any other aspect associated with the application of wastewater as a supplemental nutrient source or land application method for animal waste. If you are concerned or would like to know more information on these topics, please contact your county Cooperative Extension agent about developing a Nutrient Management Plan (NMP). The calibration of a center pivot system is important in the NMP, but only the calibration aspect of the plan will be provided here.
Introduction
Calibration is critical to the implementation of nutrient management plans. Annual calibration of nutrient management systems is required for all operations with a confined animal feeding operation (CAFO) permit. Center pivots used for the application of wastewater should also be calibrated annually, due to the nature of the material moving through the system and the need to uniformly distribute nutrients across all growing areas of application.
Application rates can change over time for many reasons. Wastewater may have abrasive particles that can wear parts of the irrigation system, including the pump, pipes, and nozzles. Worn pump parts can lead to improper or lower system pressure, lower volumes of water moving through the system, and ultimately non-uniform applications. Worn pipes can result in holes and leaks, resulting in lower than expected application rates and off-target applications. Worn nozzles can result in improper pressure and coverage area or a higher flow than reported by manufacturer specifications. Other than wear to the system, waste material can clog intake screens, pumps, pipes, and nozzles and will have similar effects as worn parts. Clogged screens and pumps will cause improper amounts of flow and pressure to be delivered to the irrigation system. Clogging or crystallization of pipes (depending on location) can lead to higher pressures in parts of the irrigation system (before clog) and lower in others (after clog), thereby resulting in uneven distribution. Clogged nozzles will also lead to uneven distribution of wastewater across the span length of the irrigation system.
Determining Application Depth
The application depth of any irrigation system is defined as the depth of liquid applied over a given area and is necessary for the calibration procedure. For center pivot systems this is calculated as follows:
Average Application Depth (inches) = Volume Pumped (gallons) / 27,154 (acre-inch) x Application Area (acres) gallons
The information needed to calculate this depth will be explained in the step-by-step directions under “Calibration Procedure.”
Since the total gallons pumped is divided by the total area, this application depth is an average. Even though this is an average value across the entire system coverage area, individual sprinklers or nozzles may not distribute water evenly across their wetted diameter. Under normal operating conditions, application rates decrease toward the outer perimeter of the wetted diameter. Due to this fact, typical irrigation designs overlap each sprinkler at least 50 percent in order to achieve uniform coverage across the entire system. If a well-designed irrigation system is operated with worn or clogged sprinklers/nozzles, the designed application depth may be achieved, but the uniformity may be unacceptable.
Recommended Calibration Times and Wind Conditions
Calibration of the center pivot should be performed during times of low evaporation and wind. The best times for low evaporation would be prior to 10 a.m. or after 4 p.m. with winds below 5 mph. On cloudy and cool days, anytime should be sufficient if winds are below 5 mph. Samples from collection cups should be measured as quickly as possible after an application to ensure minimal evaporation of collected wastewater.
Calibration Procedure
To collect wastewater from a center pivot, a series of collection cups or rain gauges should be placed in a line perpendicular to system travel. NOTE: Some county Extension offices have kits that can be used for calibration. Rain gauges work well for this since they are already marked with depth increments.
If rain gauges are not available, any cup can be used. A general guideline is to use cups or containers that have a wide mouth and constant diameter from bottom to top. Having a wide mouth and constant diameter allows the use of a ruler to measure the depth of wastewater application. The collection cups should be deep enough to both prevent wastewater from splashing out and collect the anticipated depth of liquid application. A general rule is to use at least a 4-inch-deep cup.
When collecting the wastewater samples, all cups should be the same size and shape to make data collection easier. Cups should be placed where vegetation will not interfere with liquid collection, and they should be located no more than 36 inches above the ground surface. For multiple tower systems, place the first collection cup next to the first tower wheels—this will miss the collection of wastewater from the center point to the first tower, but based on the length of the center pivot, only a small portion of wastewater will be applied in this area.
The placement of cups is important, and cups should be placed no farther apart than half the wetted diameter of the nozzle or sprinkler. If the wetted diameter of the nozzles is larger than 50 feet, the cups should be placed no more than 50 feet apart maximum. It is recommended that the cups be placed 20–25 feet apart for all sprinkler packages. The cups should also be placed so that when the system is turned on, no water enters the collection cups prior to beginning its walk toward the cups.
The system should be operated until the spray from any nozzle or sprinkler has passed all collection cups. The time it takes for the pivot to pass over all collection cups should also be recorded. After all collection cups have been passed, the following calculations should be completed.
Step-By-Step Directions
- Determine the Wetted Diameter of your nozzle or sprinkler. This can be done from manufacture information or measurement.
- Determine the Collection Cup Spacing. Generally, spacing is set at 20–25 feet.
- Based on collection cup spacing, determine the Number of Cups Needed to collect water from all sprinklers/nozzles, starting after the first tower. The cups should be labeled outward from the pivot. Ensure cups are placed to collect water from all sprinklers/nozzles, including the end gun. NOTE: For ease of data collection and calculation, make sure collection cups are all the same size and type.
- Place collection cups in a row, 20–25 feet apart, as shown in Figure 1. Initial placement of cups should be outside the Wetted Diameter of the sprinkler/nozzle and should be located in the direction of travel. Cups should be placed in a straight line parallel to the center pivot frame.
- Mark the starting point of the pivot to better determine the Travel Distance and Time of the Pivot. This can be done by placing a flag in the ground, which marks the location of the lead wheel’s hub (or some other easily recognized point on the pivot) when the liquid starts entering the collection cups. Also note the time when you place the flag.
- Operate the pivot normally until the wetted diameter of the sprinkler/nozzle has completely passed over the collection cups. Note the time when the pivot passes all of the collection cups. Place a flag at the location of the lead wheel’s hub (or whatever point you used for the initial flag placement) and measure the distance between the start and end flags. This time and distance between the start and end point will be important in Procedure 10.
- Immediately record volumes or depths of water in each collection cup. If you use something like a soup can, then measure the depth with a ruler. If you use a rain gauge, then measure the depth indicated on the gauge. Use a rain gauge that has small increments to get a more accurate reading for calculations. NOTE: Use the same units for all measurements, i.e., inches (in) vs. centimeter (cm) vs. millimeter (mm).
- Add all of the depths from data collected in Procedure 7 and divide by the total number of collection cups placed. This will give you the Average Application Depth (in inches, centimeters, or millimeters).
Average Application Depth (in, cm, mm) = Sum of collected depths (in, cm, mm) / Number of collection cups
- On pivots where an end gun is used, identify the collection cups at the outward end where the depth caught is less than half the Average Application Depth calculated in Procedure 8. The last collection cup with a depth greater than half of the Average Application Depth is considered the last “usable” cup for determining the Effective Diameter of the center pivot for which the acreage is calculated. For example: if the average depth of all cups is 10 mm, then the first cup where the depth is less than 5 mm is considered to be the last usable cup for calculating Effective Center Pivot Length. Recalculate the Average Application Depth for the “usable” collection cups identified. NOTE: All cups within the Effective Length of the center pivot are included in the calculation regardless of depth in the collection cup.
NOTE: Calculating average application amounts across an acre, using the Average Application Depth, can be accomplished by using the following calculations to find:
Gallons/Acre (depth measured in milliliters, cup diameter measured in centimeters)
- Find area of collection cup: Area (A) = 3.1417 * radius of cup * radius of cup
- Divide the Average Application Depth by the cup Area (A)
- Multiply answer from #2 by 10,692 to get Gallons/Acre
Gallons/Acre (depth measured in inches)
- Multiply inches in cup by 27,154 to get Gallons/Acre
Gallons/Acre (depth measured in millimeters)
- Multiply millimeters in cup by 1,069 to get Gallons/Acre
- Calculate the reference Travel Speed (distance per time measured in min/ft or min/m) from distance traveled (measure distance between two flags and time of travel between flags from Procedure 6).
Travel Speed (ft/min, m/min) = Distance traveled (ft, m) / Travel time (min)
- Calculate the Deviation Depth for each “usable” collection cup. The Deviation Depth is the depth difference between the Collection Cup of Interest (I) and the Average Application Depth (from calculation in Procedure 9). Take the Absolute Value of each calculated depth. Absolute Value is determined by using only the number and not the sign, so drop any negative signs. Absolute Value uses the notation of two vertical bars (|#|). For example, the Absolute Value of -7 and 7 are the same: |-7| = |7| = 7.
Deviation Depth (in, cm, mm) = |depth collected in cup I – Average Application Depth|(“I” refers to the collection cup number.)
- Add sums computed in Procedure 11 to determine the Sum of Deviation, and divide by the number of collection cups to get the Average Deviation Depth.
Average Deviation Depth (in, cm, mm) = Sum of deviation depths from Procedure 11 / Number of usable cups
- Calculate the Application Uniformity (Uc). The Application Uniformity is often computed using the mathematical formula referred to as the Christiansen Uniformity Coefficient. It is computed as follows:
Uc = (Average depth from Procedure 8 – Average deviation from Procedure 12)
/ Average depth from Procedure 8 x100
- Use this calculated Application Uniformity (Uc) to determine the calibration results. The higher the Uniformity Coefficient and the closer to 100, the better the center pivot Application Uniformity (Table 1).
A calculated Application Uniformity of 100 indicates a “Perfect” uniformity, and the amount collected in every cup is the same. For a center pivot operated in a light wind, an Application Uniformity of greater than 85 is common and is determined to be “Great.” For Application Uniformities in the rage of 70–85, this uniformity is considered “Good” and is acceptable for wastewater application. Application Uniformities below 70 are generally considered to be “Unacceptable” for wastewater application and requires the center pivot system to be adjusted (see next section—Using a Graph to Determine Where Problems Exist—for more information on where problems may be located). Common problems for low Application Uniformities can include, but are not limited to, clogged sprinklers or nozzles, worn sprinklers or nozzles, sprinklers not rotating properly, inadequate system pressure, sprinklers installed in wrong order, end gun not functioning properly, wrong size end gun, and missing sprinkler or nozzle. There may be others based on your system. If you need assistance please contact your irrigation dealer, technical specialist, or Extension agent.
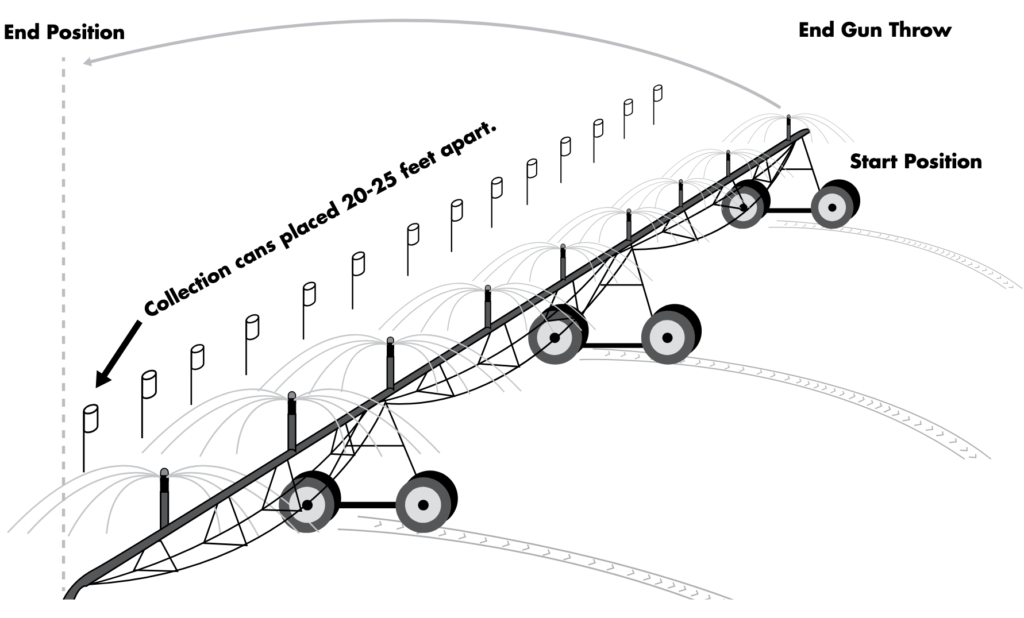
Image by Megan McCoy, UGA Office of Communications and Creative Services.
| Uniformity Coefficient (Uc) | Acceptability for Wastewater Application |
|---|---|
| 100 | Perfect application across center pivot to acceptable |
| 85–99 | Great application to acceptable |
| 70–85 | Good application to acceptable |
| Below 70 | Not acceptable to adjustments required |
Using a Graph to Determine Where Problems Exist
The following pages have data collection sheets for ease of recording data. After entering this collected data into a computer based spreadsheet, the values described in the procedure steps can be easily calculated, and a graph can be produced to show where problem(s) may be located. For example, if there is a location on the graph where the application depth or uniformity coefficient is much greater than the other locations, this may indicate a worn, malfunctioning, or missing sprinkler. A location much lower than the other locations could indicate a clogged sprinkler. Other problems could exist and the graph would provide a visual indicator of where to check for the problem.
Conclusion
Calibrating the center pivot for wastewater application is a needed activity to ensure proper application of nutrients and water as well as protecting the environment. For more information on Best Management Practices and Comprehensive Conservation Plans for you farm please contact your local University of Georgia Extension Office at 1-800-ASK-UGA1.
References
Evans, R. O., Baker, J. C., Smith, J. T., & Sheffield, R. E. (1997). Field calibration procedures for animal wastewater application equipment: Center pivot and linear move irrigation system (Bulletin No. AG-553-3). NC State Extension. https://content.ces.ncsu.edu/center-pivot-and-linear-move-irrigation-system
Smith, B., & Chastain, J. (2003). Irrigation Application Calibration Methods. Confined Animal Manure Manager (CAMM) Program: Poultry Training Manual, Chapter 6. https://www.clemson.edu/extension/camm/manuals/common_chapters/pch6a_03.pdf