Step-by-Step Calibration Procedure (Equations for calculations are on the following data worksheets)
- Determine the Wetted Diameter of your nozzle or sprinkler.
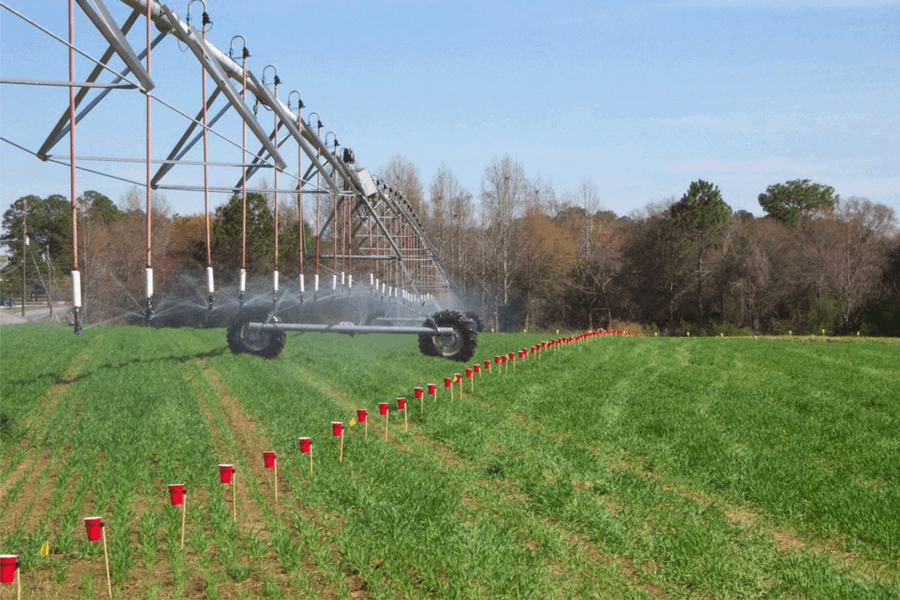
- Determine the Collection Cup Spacing. Generally, 25 feet up to max of 50 feet between cups.
- Determine Number of Cups Needed to collect wastewater from all sprinklers/nozzles starting after the first tower.
- Place collection cups in a row, equally spaced in the direction of travel.
- Mark the starting point. Operate the pivot normally and mark the end point. Measure the Time taken for the system to pass over all cups. Measure between the start and end points to determine the Travel Distance.
- Immediately record volumes or depths of water in each collection cup.
- Calculate Average Application Depth (inches, centimeters, or millimeters).
- Determine “usable” cups and Effective Diameter of pivot.
- Recalculate the Average Application Depth for the “usable” collection cups (using data from Proc. 7).
- Calculate the reference Travel Speed.
- Calculate the Deviation Depth for each “usable” collection cup.
- Determine the Average Deviation Depth (using data from Proc.11).
- Calculate the Application Uniformity (Uc).
- Determine the calibration results (using Table 1).
| Uniformity Coefficient (Uc) | Acceptability for Wastewater Application |
|---|---|
| 100 | Perfect application across center pivot to acceptable |
| 85–99 | Great application to acceptable |
| 70–85 | Good application to acceptable |
| Below 70 | Not acceptable to adjustments required |
Collection Table for Calibrating a Wastewater Center Pivot System
| Collection Cup Label | Measured Depth of Liquid (in, cm, mm) |
Deviation Depth (Absolute difference from measured and average depth) (in, cm, mm) | Christiansen Uniformity Coefficient (Uc) | Comments |
|---|---|---|---|---|
| TOTAL SUM | ||||
| AVERAGE |
Calculation Sheet Used for Calibrating a Wastewater Center Pivot System
NOTE: The following notation is used below:
Step # (Corresponding procedure # from text).
Step 1 (Proc. 1) Wetted Diameter of sprinkler or nozzle:
________________ (feet, meters, inches)
Step 2 (Proc. 2) Spacing between each collection cup: ____________________ (feet, meters, inches)
Step 3 (Proc. 6) Time for center pivot tower to move across all cups: ____________________ minutes
Step 4 (Proc. 6) Travel Distance to get complete coverage of cups: ____________________ feet/meters
Step 5 (Proc. 7) Measure depths in each collection cup.
Use data collection table (on page 7).
Step 6 (Proc. 8) Calculate Average Application Depth:
Average Application Depth (in, cm, mm) =
____________________ (in, cm, mm) =
Step 7 (Proc. 9) Calculate Usable Average Application Depth from the usable collection cups. These are the cups where the measured depth is greater than half the Average Application Depth.
Usable Average Application Depth (in, cm, mm) =
____________________ (in, cm, mm) =
Step 8 (Proc. 10) Compute reference Travel Speed:
Travel Speed =
____________________ = ____________________
Step 9 (Proc. 11-12) Calculate Average Deviation Depth:
Average Application Depth (in, cm, mm)
=
____________________ (in, cm, mm)
=
Step 10 (Proc. 13) Calculate Christiansen Uniformity Coefficient (Uc):
Uc = x100
________ = x100
Step 11 (Proc. 14) Determine the calibration results using the table below.
| Uniformity Coefficient (Uc) | Acceptability for Wastewater Application |
|---|---|
| 100 | Perfect application across center pivot to acceptable |
| 85 – 99 | Great application to acceptable |
| 70 – 85 | Good application to acceptable |
| Below 70 | Not acceptable to adjustments required |
Calculation of Application Rates Based on Different Ways of Measuring Volume in Collection Cups
If amount of liquid in collection cups (assuming equal diameter at top and bottom) is measured in inches, then the following gallons per acre were applied. The numbers are summative, so to calculate 1.5 inches, add the 1.0 and 0.5 numbers.
| Inch in Cup | 0.1 | 0.2 | 0.3 | 0.4 | 0.5 | 0.6 | 0.7 | 0.8 | 0.9 | 1 |
|---|---|---|---|---|---|---|---|---|---|---|
| Gallons/Acre | 2,715 | 5,431 | 8,146 | 10,862 | 13,577 | 16,292 | 19,008 | 21,723 | 24,439 | 27,154 |
The following table provides information on the gallons per acre applied if the volume in the collection cups is measured in milliliters (ml). The bolded numbers on the left side are in equal increments of inches.
| Cup Measurement | Milliliters in Collection Cups | |||||||
|---|---|---|---|---|---|---|---|---|
| cm | inches | 1 | 10 | 20 | 30 | 40 | 50 | 60 |
| 1 | 0.39 | 13,613 | 136,135 | 272,270 | 408,404 | 544,539 | 680,674 | 816,809 |
| 1.27 | 0.50 | 8,440 | 84,404 | 168,807 | 253,211 | 337,615 | 422,019 | 506,422 |
| 2 | 0.79 | 3,403 | 34,034 | 68,067 | 102,101 | 136,135 | 170,168 | 204,202 |
| 2.54 | 1.00 | 2,110 | 21,101 | 42,202 | 63,303 | 84,404 | 105,505 | 126,606 |
| 3 | 1.18 | 1,513 | 15,126 | 30,252 | 45,378 | 60,504 | 75,630 | 90,757 |
| 4 | 1.57 | 851 | 8,508 | 17,017 | 25,525 | 34,034 | 42,542 | 51,051 |
| 5 | 1.97 | 545 | 5,445 | 10,891 | 16,336 | 21,782 | 27,227 | 32,672 |
| 6 | 2.36 | 378 | 3,782 | 7,563 | 11,345 | 15,126 | 18,908 | 22,689 |
| 7 | 2.76 | 278 | 2,778 | 5,557 | 8,335 | 11,113 | 13,891 | 16,670 |
| 7.62 | 3.00 | 234 | 2,345 | 4,689 | 7,034 | 9,378 | 11,723 | 14,067 |
| 8 | 3.15 | 213 | 2,127 | 4,254 | 6,381 | 8,508 | 10,636 | 12,763 |
| 9 | 3.54 | 168 | 1,681 | 3,361 | 5,042 | 6,723 | 8,403 | 10,084 |
| 10 | 3.94 | 136 | 1,361 | 2,723 | 4,084 | 5,445 | 6,807 | 8,168 |
| 10.16 | 4.00 | 132 | 1,319 | 2,638 | 3,956 | 5,275 | 6,594 | 7,913 |
| 11 | 4.33 | 113 | 1,125 | 2,250 | 3,375 | 4,500 | 5,625 | 6,750 |
| 12 | 4.72 | 95 | 945 | 1,891 | 2,836 | 3,782 | 4,727 | 5,672 |
| 12.7 | 5.00 | 84 | 844 | 1,688 | 2,532 | 3,376 | 4,220 | 5,064 |
| 15.24 | 6.00 | 59 | 586 | 1,172 | 1,758 | 2,345 | 2,931 | 3,517 |
Reference
Hawkins, G. L., Porter, W., Hollifield, S., & Shirley, B. (2016). Calibration of center pivot systems for wastewater applications (Publication No. B 1458). University of Georgia Cooperative Extension.