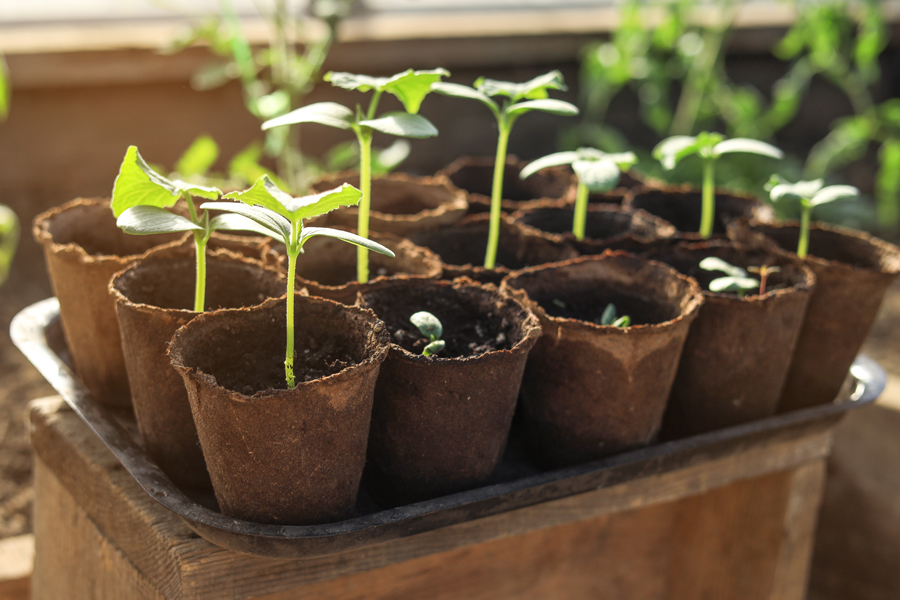


Container plants are an economically important and rapidly growing sector in nursery and greenhouse plant production of ornamentals, vegetables, and herbs. Managing resource supplies and identifying biotic (caused by living organisms) and abiotic (caused by something other than living organisms) plant stressors are essential maintenance tasks in container-plant production. However, there are relatively simple imaging systems that container plant producers can use to monitor certain issues. This resource provides growers with information about using regular cameras to monitor their plants’ nutrient status and provide the right level of fertilizer to maximize production and minimize waste.
Takeaways
- RGB image analysis is relatively easy to do: Smartphones or consumer digital cameras can capture the data, inexpensive computing equipment can be used to store/process data, and there are free tools for analyzing the data.
- RGB imaging can detect problems with plant nutrition: plant canopy area, color, and texture can all be evaluated with RGB imaging, and these characteristics can provide valuable information about nutrient deficiencies or excesses.
Untimely and insufficient fertilizer application can adversely affect plant physiological and biochemical responses and eventually result in significant deterioration in plant health with reduced foliar and floral quality. Excessive fertilizer will build up salts with high electrical conductivity, causing osmotic (movement of water in and out of tissues) stress, nutrient imbalances, and phytotoxicity (poisoning), including leaf burn, distortion, and stunted growth. Meanwhile, excess fertilizer use can also cause economic waste, eutrophication (a reduction in dissolved oxygen in water caused by excessive nitrogen and phosphorus leaching from fertilizer into bodies of water), and environmental pollution.
Related Content
Semi- and fully controlled environments provide relatively stable climatic conditions; however, the combination of high humidity, limited air circulation, dense monoculture (production of only one type of crop) plantings, pathogen sources from soil, plant debris, and the surrounding environment can create favorable conditions for rapid pathogen growth and symptom development. Common diseases include root rot, powdery mildew, damping-off, gray mold, leaf spot, blight, etc. Such outbreaks can severely reduce crop productivity and quality.
Other biotic and abiotic stresses, including pest damage, weed competition, temperature extremes, salinity, and irrigation-related stresses, can significantly reduce crop quality and productivity, making accurate and timely detection essential.
Plant Nutrient Management
Plant nutrient management can be tricky, as every plant has different nutrient needs, and nutrient demand varies across development stages. Traditional detection methods for nutrient concentrations, disease symptoms, and other unfavorable plant development conditions typically involve visual inspection by experts, destructive sampling, and laboratory testing, which are labor-intensive, time-consuming, and require highly trained personnel. To create a better fertilizer program, producers must track changes in plant nutrient status to adjust the fertilizer supply in a timely manner.
Light Analysis in Plant Nutrient Management
Recent advances in imaging analysis and artificial intelligence (AI) provide approaches in automatic monitoring and detection of plant health and growth that can be used in container crop production.
The reason that we can extract information from photographs is answered by the word itself: “photograph” is the combination of the Greek words “Phos” (light) and “graph” (drawing), meaning “drawing with light.” This is done by capturing reflected light from an illuminated subject and recording it with an image sensor. Light can be categorized by wavelength, which reveals characteristics such as light energy levels and visibility (Figure 1), including ultraviolet (UV, < 380 nanometers [nm]), visible (380–750 nm), and infrared (IR, > 750 nm) light.
How are different light sources utilized to extract plant information through imaging analysis? Based on light wavelengths, different imaging systems can detect plant nutrient status and provide a method for nondestructive plant nutrient management.

How RGB Image Analysis Works
Under abiotic stress conditions, including nutrient stress, plants show morphological, physiological, and biochemical changes, such as reflected light ratio, leaf color, texture, and so on. Imaging analysis can capture these changes and inform the understanding of plant nutrient status.
Take plant nitrogen analysis as an example: There is a direct link between leaf chlorophyll content and nitrogen concentration, and chlorophyll has distinct absorption and reflection properties across red and blue light wavelengths. These properties enable rapid, noninvasive measurement using optical meters or reflectance sensors to determine nitrogen status. These methods have been developed and implemented in real production and include red-green-blue (RGB) imaging, fluorescence, and spectroscopy imaging systems.
How Does RGB Imaging Help With Plant Nutrient Detection?
Because it records visible light (400–700 nm), RGB imaging has the potential for widespread use. It offers easy operation and adaptation, free access, and a relatively low camera cost—you can simply use a smartphone or a regular digital camera—although their detection capabilities are limited to plant morphology and leaf color.
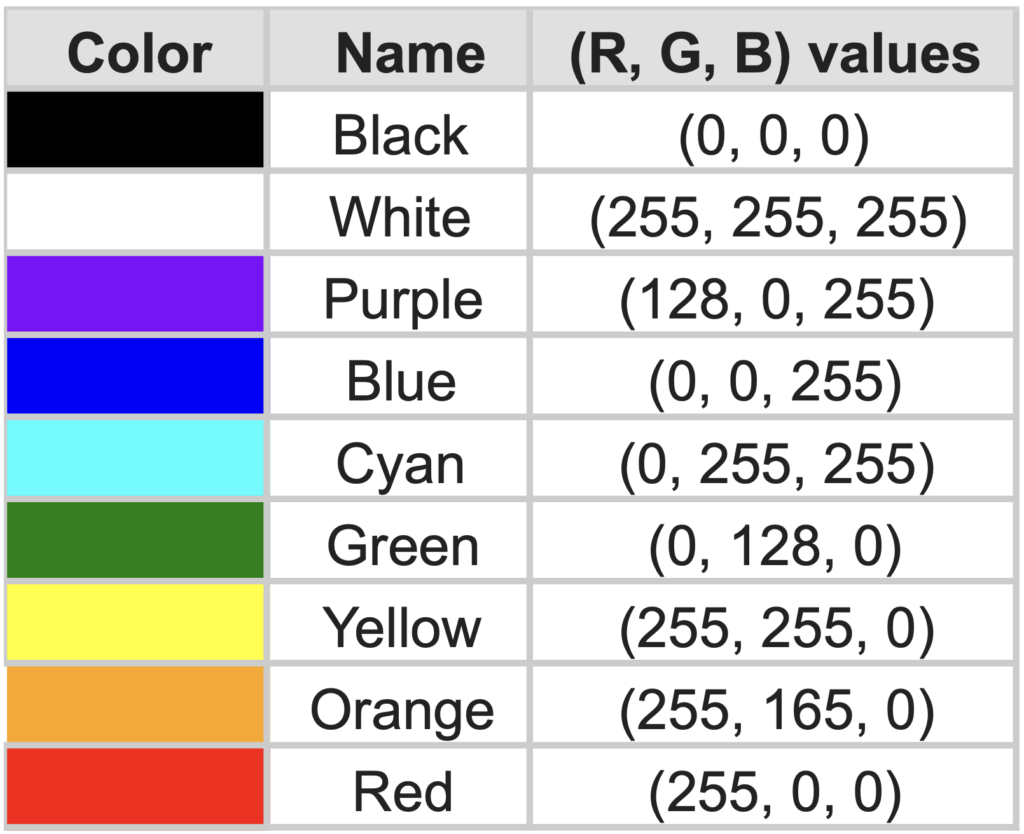
The RGB color model uses numerical values between 0 and 255 for each color channel, and more than 16 million colors can be made by combining the values of these three primary colors of light (see Figure 2 for examples). Plant canopy area, color, and texture can be analyzed using RGB images. Variations in RGB values can be observed in response to different nutrient treatments, as plant leaves often appear light green, yellow, red, or even brown under nutrient stress.
How Can Growers Use RGB Imaging in Plant Production?
Using a standard camera, images are taken overhead using a known-area square. Inside the image analysis software, the plant canopy will be extracted from the background by automated thresholding, creating an image mask to quantify the canopy area. Then the images are converted into various color spaces to extract and compute the mean values of the red, green, and blue channels through an automated color-analysis workflow (Figure 3). These images can also be converted for specific analysis purposes into the L*a*b* (L is the channel for brightness; a is the channel for the red-green axis; and b is the channel for the yellow-blue axis) or HSV (hue, saturation, value) color spaces.

After obtaining information from imaging analysis, machine learning can be used to classify plant nutrient status based on targeted value references. These values can indicate fertilizer input levels as underuse (plant has reduced and even stunted growth), sufficient use (plant has normal growth), and overuse (plant growth is not improved even with increased fertilizer input). Machine learning technology is an efficient and easy-to-use analytical tool. Supervised learning has shown promise to provide references for fertilization guidance (underuse or overuse) at the whole-plant level.
Example RGB Imaging Analysis Study
An example from one of the studies using RGB imaging analysis combined with machine learning models may give you a better understanding of how RGB analysis works. The RGB images were taken three times a week using an RGB camera mounted on a tripod positioned at a constant height at the beginning of the experiment.
Once the images were captured, they were imported into the free software package ImageJ. Using a threshold automatically generated by the software, the plant canopy was extracted from the background and became a “mask” for calculating the canopy area. Next, the images were converted to different color spaces to extract the average red, green, and blue values through an automated color analysis workflow (see the examples in Figure 3).
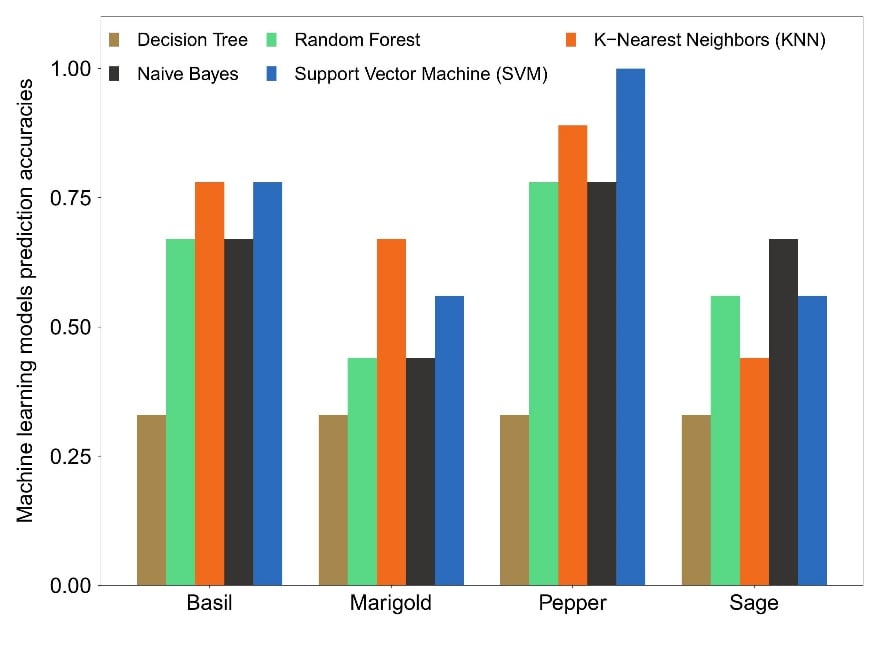
R software, another free tool, was used to analyze data and evaluate the RGB imaging analysis system accurately. The results showed that the RGB imaging analysis system can catch the differences in plant nutrient status within 2–3 weeks. The earliest time frame and highest prediction accuracy ranges for basil were 10–17 days and 0.7–0.8, respectively; for marigold, 10–15 days and 0.6–0.7; for pepper, 17–24 days and 0.9–1.0; for sage, 21–25 days and 0.6–0.7 (Figure 4). In general, most peak prediction accuracies were observed between 2–3 weeks after treatment started.
Other Image Analysis Methods
Besides RGB analysis for morphology and leaf color detection, spectroscopy imaging is another commercially available system. It can detect multiple wavelength ranges (400–13000 nm) beyond visible light, including near-infrared, the most widely used region of the spectrum because of its strong correlation with leaf nitrogen and plant health status. For precision nutrient and irrigation management, spectroscopy offers advantages in the early detection of stress before symptoms are visible, but equipment comes at a high cost (more than $10,000), and this method requires complex data extraction and analysis.
As a detection tool for plant physiology, fluorescence imaging measures chlorophyll fluorescence, an indicator of photosynthetic performance. The method measures the reemission of light at longer wavelengths after the radiation at shorter wavelengths is absorbed by the plant. It uses multiband filters to capture the reemitted light, measuring wavelengths of blue (440 nm), green (520 nm), red (690 nm), and far-red (740 nm) light, which are sensitive indicators of nutrient stress that affect photosynthesis even when visual symptoms are not present.
Future Adaptation of Imaging Analysis for Plants
The study found that combining RGB imaging with machine learning techniques, when used to support fertilization scheduling and decision-making in container-grown plants, offers an affordable and practical solution for real-time nutrient monitoring. Specifically, developing such an imaging system doesn’t require high-end equipment; basic RGB photos taken with a smartphone or inexpensive setups using devices like a Raspberry Pi and low-cost camera modules (less than $100 total) can be sufficient.
However, it may take extra time to detect early-stage nutrient deficiencies when young plants are less susceptible to nutrient stress; this issue can be addressed using multispectral imaging systems to identify plant physiological responses. In this situation, a more accurate imaging analysis, such as spectroscopy imaging, needs to be evaluated and adapted. However, spectroscopy imaging tends to be more expensive than RGB imaging, making it harder for growers to adopt on a large scale.
As imaging analysis approaches continue to advance (reducing financial burdens and technical barriers), nursery and greenhouse operations will benefit from more precise, timely, and sustainable management strategies. Adoption of imaging-based monitoring systems, combined with grower expertise, has the potential to maintain high-quality container crop production and reduce losses caused by nutrient stress. It also has the potential to strengthen the economic and environmental sustainability of the green industry. For more information about using RGB imaging analysis for container plant nutrient status, please contact your local Extension office.
References
Li, D., Li, C., Yao, Y., Li, M., & Liu, L. (2020). Modern imaging techniques in plant nutrition analysis: A review. Computers and Electronics in Agriculture, 174, 105459. https://doi.org/10.1016/j.compag.2020.105459
Yu, P., & Qin, K. (2025). Exploring a cost-effective way for nutrient management with machine learning for container plants. Technology in Horticulture, 5, e012. https://doi.org/10.48130/tihort-0025-0007