
Irrigation Water Background
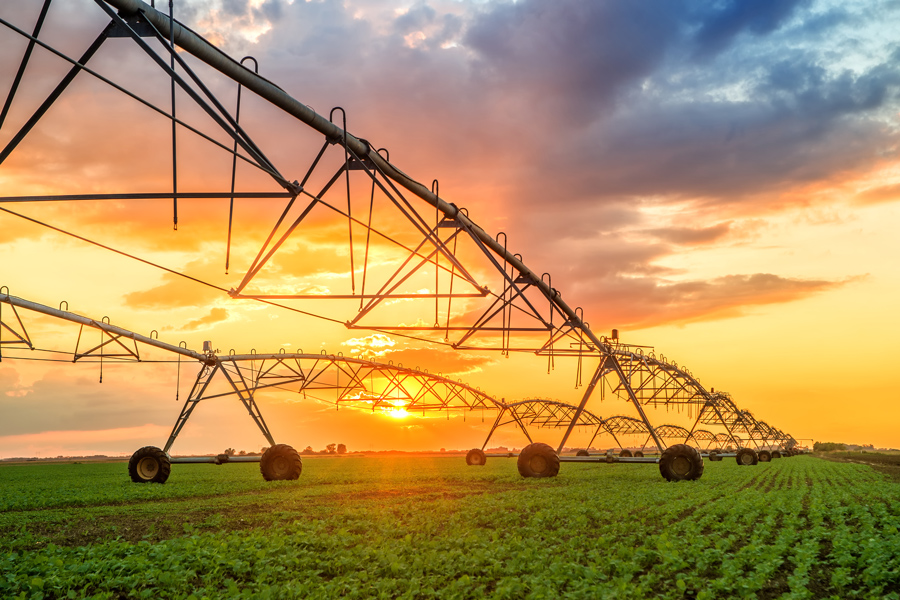
In the past, there were minor concerns for farmers or agricultural crop advisors regarding either the quantity or the quality of irrigation water in Georgia. This is because only a small amount of acreage under irrigated agriculture utilized potable (suitable for drinking) quality water. Thus, quality of irrigation water was not closely monitored or regulated. However, recently the nature and extent of irrigated agriculture has changed with respect to water quantity and quality in Georgia as well as in several other states. With growing demands for potable water (due to population increase) and expanding irrigated acreage, there is an increased pressure on irrigated farms to consider using non-potable alternatives.
According to the Georgia Comprehensive State-wide Water Management Plan (State Water Plan) 2008 (available at www.georgiawaterplanning.org), the irrigated acreage in Georgia increased from 0.2 million acres in 1975 to around 1.5 million acres in 2008 (Figure 1). A progressive increase in irrigated acreage has been forecasted in years to come, surpassing 1.65 million acres in 2050.

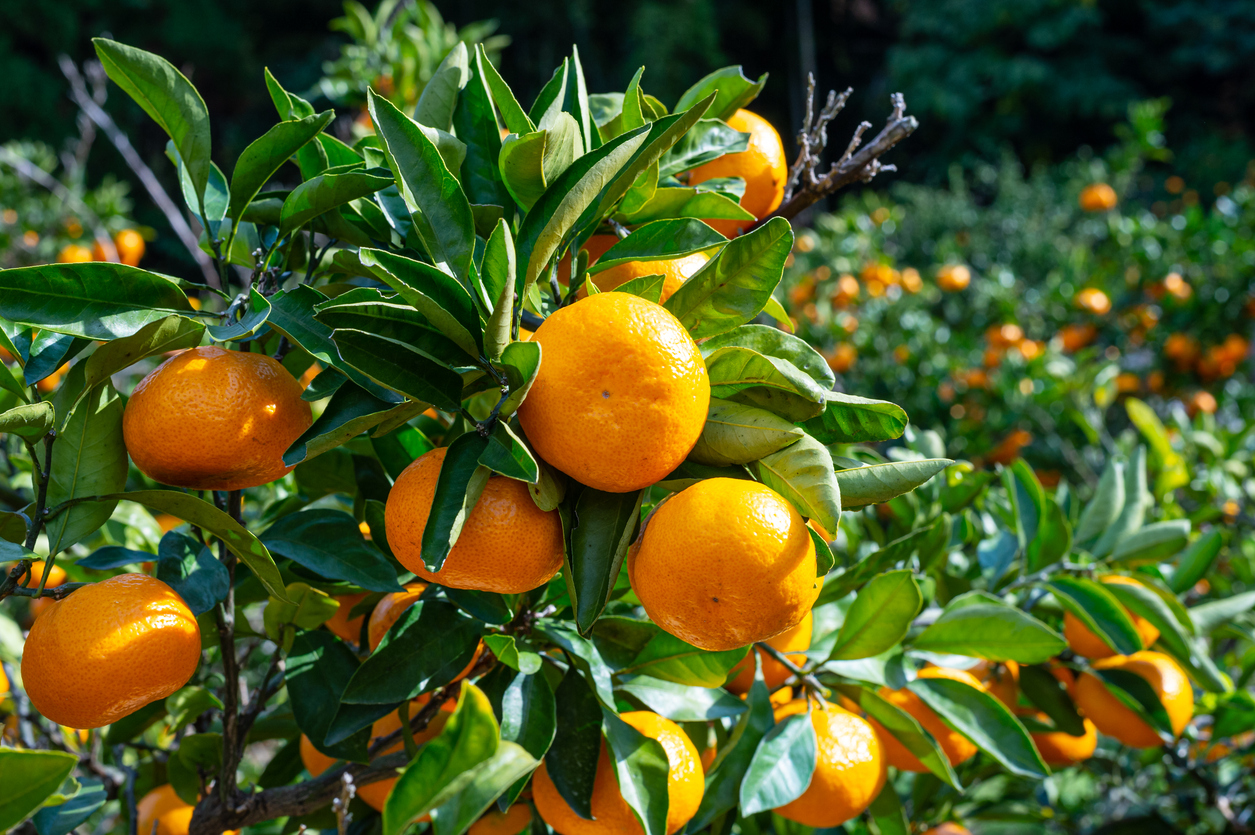
Historically, traditional row crops such as cotton, peanut, corn, and soybean dominate the Georgia agricultural landscape. Additionally, pecans, vegetables and fruit, nurseries and other specialty crops are economically significant and account for a large share of irrigation water use.
Why Does Irrigation Water Quality Matter?
Understanding irrigation water quality is critical to determining appropriate crop and soil management practices that are necessary for long-term productivity. Water quality affects:
- Fertility needs of the crop
- Crop yield
- Soil physical conditions
- Soil salinity
- Irrigation system performance and longevity
- Water application method
Know Your Water Quality!
- Quality of water for agricultural irrigation is critical to understanding management for long-term productivity.
- In some cases, irrigation water quality can be a more important factor influencing crop yield than soil fertility, cultivar used, weed control, and other factors.
- Low quality irrigation water can adversely affect soil physical conditions.
What Are the Major Attributes of Irrigation Water Quality?
Typically, qualities of irrigation water deserving primary consideration include:
- Soluble salts content
- Sodium concentration
- Concentration of toxic elements and compounds
- Presence and abundance of macro- and micro-nutrients, and trace elements
- Alkalinity, acidity, and hardness of the water
Depending on the circumstances, the suspended sediment concentration, bacterial content, and temperature of irrigation water may also deserve attention.
Common Units Used to Express and Evaluate Irrigation Water Quality
Water quality parameters are reported in various units depending on the laboratory. An understanding of these units and the conversion factors to convert one to another could be helpful. Use Table 1 for this purpose.
| Component | Convert From | Multiply By | Convert To |
|---|---|---|---|
| Water nutrient or TDS1 | mg/L | 1.0 | ppm |
| Water nutrient or TDS | mg/L or ppm | 0.227 | lb/acre-inch of water |
| Water salinity (ECw)2 | dS/m | 1.0 | mmohs/cm |
| Water salinity (ECw) | mmhos/cm | 1000 | µmhos/cm |
| Water salinity (ECw) | dS/m | 1000 | µmhos/cm |
| Water salinity (ECw) | For ECw lower than 5 dS/m | 640 | TDS in mg/L or ppm |
| Water salinity (ECw) | For ECw higher than 5 dS/m | 800 | TDS in mg/L or ppm |
| Calcium content of water | mg/L or ppm | 0.0499 | meq/L |
| Magnesium content of water | mg/L or ppm | 0.0823 | meq/L |
| Sodium content of water | mg/L or ppm | 0.0435 | meq/L |
| Carbonate content of water | mg/L or ppm | 0.0167 | meq/L |
| Bicarbonate content of water | mg/L or ppm | 0.0163 | meq/L |
| Chloride content of water | mg/L or ppm | 0.0282 | meq/L |
| Water NO3-N, SO4-S, B applied | mg/L or ppm | 2.72 | lb/acre-foot of water |
| Water NO3-N, SO4-S, B applied | mg/L or ppm | 0.227 | lb/acre-inch of water |
| Irrigation water | acre-inch | 27,150 | gallons of water |
| 1 TDS means total dissolved solids in the irrigation water; ppm stands for “parts per million.” 2 ECw means electrical conductivity of the irrigation water. | |||
Soluble Salts Content or Salinity or Conductivity
All water contains some salts [Note: Salts for the purpose of irrigation water quality include not only sodium chloride (common/table salt), but also other chorides, carbonate/bicarbonates, and sulfate salts of sodium, calcium, and magnesium]. Typically, groundwater contains more salts than surface water. Water salinity represents the amount of dissolved salts in water. It is usually measured by the ability of water to conduct electricity, called “Electrical Conductivity” or EC. The EC of water (ECw) goes up with the increase of dissolved salts. The ECw is reported in one of the three acceptable units: deciSiemen per meter (dS/m), millimhos per centimeter (mmhos/cm), or micromhos per centimeter (μmhos/cm). The conversion factors for one unit to another are given below:
- 1 dS/m = 1 mmho/cm = 1,000 μmhos/cm
Another measure of water salinity is Total Dissolved Solids (TDS). It is sometimes referred to as the total salinity and is expressed in parts per million (ppm), which is equivalent to another unit called milligrams per liter (mg/L). Another important unit used in water salinity analysis and management is millequivalent per liter (meq/L); the factor to convert mg/L to meq/L and vice versa depends on the element or compound in question (Table 1).
A “Rough” Estimate of Salt in Water
Water with electrical conductivity (ECw) of only 1.15 dS/m contains approximately 2,000 pounds of salt for every acre-foot of water.
Harmful Effects of Soluble Salts Content or Salinity of Irrigation Water
Water with high salinity that is harmful to plants is called a salinity hazard. High concentrations of salts in the soil’s water (soil solution) can result in a physiological drought condition in field crops. Under such conditions, a crop may appear stressed for water and even wilt despite the availability of adequate soil moisture because the roots are not able to absorb the water from a concentrated soil solution.
A number of useful guidelines for evaluating salinity hazard of irrigation water are available. A brief summary of those guidelines is presented in Table 2. Note: hazards from irrigation water salinity and soil salinity are not equivalent.
Tolerance of various crops to the salinity of irrigation water is given in Tables 3a-d. They may be used as a guideline for selecting crops based on the available irrigation water salinity.
| Measures of Salinity | Degree of Restriction on Use | ||
|---|---|---|---|
| None | Slight to Moderate | Severe | |
| ECw1 (mmhos/cm or dS/m) | < 0.7 | 0.7–3.0 | > 3.0 |
| TDS1 (mg/L) | < 450 | 450–2,000 | > 2,000 |
| Crop | Expected Yield Reduction in Percent at various ECw | Maximum Tolerable ECw (mmhos/cm or dS/m)2 | |||
|---|---|---|---|---|---|
| 0% | 10% | 25% | 50% | ||
| ECw (mmhos/cm or dS/m)1 | |||||
| Field Crops | |||||
| Barley (Hordeum vulgare)3 | 5.3 | 6.7 | 8.7 | 12 | 19 |
| Broadbean (Vicia faba) | 1.1 | 1.8 | 2.0 | 4.5 | 8.0 |
| Bean (Phaseolus vulgaris) | 0.7 | 1.0 | 1.5 | 2.4 | 4.2 |
| Corn (Zea mays) | 1.1 | 1.7 | 2.5 | 3.9 | 6.7 |
| Cotton (Gossypium hirsutum) | 5.1 | 6.4 | 8.4 | 12 | 18 |
| Cowpea (Vigna unguiculata) | 3.3 | 3.8 | 4.7 | 6.0 | 8.8 |
| Flax (Linum usitatissimum) | 1.1 | 1.7 | 2.5 | 3.9 | 6.7 |
| Groundnut (Arachis hypogaea) | 2.1 | 2.4 | 2.7 | 3.3 | 4.4 |
| Rice (Oryza sativa) | 2.0 | 2.6 | 3.4 | 4.8 | 7.6 |
| Sorghum (Sorghum bicolor) | 4.5 | 5.0 | 5.6 | 6.7 | 8.7 |
| Soybean (Glycine max) | 3.3 | 3.7 | 4.2 | 5.0 | 6.7 |
| Sugarbeet (Beta vulgaris)4 | 4.7 | 5.8 | 7.5 | 10 | 16 |
| Wheat (Triticum aestivum)3,5 | 4.0 | 4.9 | 6.3 | 8.7 | 13 |
| Wheat, durum (Triticum turgidum) | 3.8 | 5.0 | 6.9 | 10 | 16 |
| Vegetable Crops | |||||
| Bean (Phaseolus vulgaris) | 0.7 | 1.0 | 1.5 | 2.4 | 4.2 |
| Beet, red (Beta vulgaris)3 | 2.7 | 3.4 | 4.5 | 6.4 | 10 |
| Broccoli (Brassica oleracea botrytis) | 1.9 | 2.6 | 3.7 | 5.5 | 9.1 |
| Cabbage (Brassica oleracea capitata) | 1.2 | 1.9 | 2.9 | 4.6 | 8.1 |
| Carrot (Daucus carota) | 0.7 | 1.1 | 1.9 | 3.0 | 5.4 |
| Celery (Apium graveolens) | 1.2 | 2.3 | 3.9 | 6.6 | 12 |
| Corn, sweet (Zea mays) | 1.1 | 1.7 | 2.5 | 3.9 | 6.7 |
| Cucumber (Cucumis sativus) | 1.7 | 2.2 | 2.9 | 4.2 | 6.8 |
| Lettuce (Lactuca sativa) | 0.9 | 1.4 | 2.1 | 3.4 | 6.0 |
| Onion (Allium cepa) | 0.8 | 1.2 | 1.8 | 2.9 | 5.0 |
| Pepper (Capsicum annuum) | 1.0 | 1.5 | 2.2 | 3.4 | 5.8 |
| Potato (Solanum tuberosum) | 1.1 | 1.7 | 2.5 | 3.9 | 6.7 |
| Radish (Raphanus sativus) | 0.8 | 1.3 | 2.1 | 3.4 | 5.9 |
| Spinach (Spinacia oleracea) | 1.3 | 2.2 | 3.5 | 5.7 | 10 |
| Squash, scallop (Cucurbita pepo melopepo) | 2.1 | 2.6 | 3.2 | 4.2 | 6.3 |
| Squash, zucchini (Cucurbita pepo melopepo) | 3.1 | 3.8 | 4.9 | 6.7 | 10 |
| Sweet potato (Ipomoea batatas) | 1.0 | 1.6 | 2.5 | 4.0 | 7.1 |
| Tomato (Lycopersicon esculentum) | 1.7 | 2.3 | 3.4 | 5.0 | 8.4 |
| Turnip (Brassica rapa) | 0.6 | 1.3 | 2.5 | 4.3 | 8.0 |
| Forage Crops | |||||
| Alfalfa (Medicago sativa) | 1.3 | 2.2 | 3.6 | 5.9 | 10 |
| Barley (forage) (Hordeum vulgare)3 | 4.0 | 4.9 | 6.4 | 8.7 | 13 |
| Bermuda grass (Cynodon dactylon)4 | 4.6 | 5.6 | 7.2 | 9.8 | 15 |
| Clover (Trifolium alexandrinum) | 1.0 | 2.2 | 3.9 | 6.8 | 13 |
| Clover, red (Trifolium pratense) | 1.0 | 1.6 | 2.4 | 3.8 | 6.6 |
| Clover, alsike (Trifolium hybridum) | 1.0 | 1.6 | 2.4 | 3.8 | 6.6 |
| Clover, ladino (Trifolium repens) | 1.0 | 1.6 | 2.4 | 3.8 | 6.6 |
| Clover, strawberry (Trifolium fragiferum) | 1.0 | 1.6 | 2.4 | 3.8 | 6.6 |
| Corn (forage) (Zea mays) | 1.2 | 2.1 | 3.5 | 5.7 | 10 |
| Cowpea (forage) (Vigna unguiculata) | 1.7 | 2.3 | 3.2 | 4.8 | 7.8 |
| Harding grass (Phalaris tuberosa) | 3.1 | 3.9 | 5.3 | 7.4 | 12 |
| Orchard grass (Dactylis glomerata) | 1.0 | 2.1 | 3.7 | 6.4 | 12 |
| Lovegrass (Eragrostis sp.) | 1.3 | 2.1 | 3.3 | 5.3 | 9.3 |
| Perennial ryegrass (Lolium perenne) | 3.7 | 4.6 | 5.9 | 8.1 | 13 |
| Sesbania (Sesbania exaltata) | 1.5 | 2.5 | 3.9 | 6.3 | 11 |
| Sudan grass (Sorghum sudanense) | 1.9 | 3.4 | 5.7 | 9.6 | 17 |
| Tall fescue (Festuca elatior) | 2.6 | 3.6 | 5.2 | 7.8 | 13 |
| Wheatgrass, tall (Agropyron elongatum) | 5.0 | 6.6 | 9.0 | 13 | 21 |
| Wheatgrass, crested (Agropyron cristatum) | 5.0 | 6.0 | 7.4 | 9.8 | 15 |
| Wheatgrass, siberian (Agropyron sibiricum) | 2.3 | 4.0 | 6.5 | 11 | 19 |
| Wildrye, beardless (Elymus triticoides) | 1.8 | 2.9 | 4.6 | 7.4 | 13 |
| Vetch, common (Vicia angustifolia) | 2.0 | 2.6 | 3.5 | 5.0 | 8.1 |
| Fruit Crops | |||||
| Almond (Prunus dulcis)3 | 1.0 | 1.4 | 1.9 | 2.8 | 4.5 |
| Apple, pear (Malus domestica, Pyrus sp.) | 1.0 | 1.6 | 2.2 | 3.2 | – |
| Apricot (Prunus armeniaca)3 | 1.1 | 1.3 | 1.8 | 2.5 | 3.8 |
| Avocado (Persea americana) | 0.9 | 1.2 | 1.7 | 2.4 | – |
| Blackberry (Rubus sp.) | 1.0 | 1.3 | 1.8 | 2.5 | 4.0 |
| Boysenberry (Rubus ursinus) | 1.0 | 1.3 | 1.8 | 2.5 | 4.0 |
| Date palm (Phoenix dactylifera) | 2.7 | 4.5 | 7.3 | 12 | 21 |
| Fig, olive, pomegranate (Ficus carica, Olea sp., Punica granatum) | 1.8 | 2.6 | 3.7 | 5.6 | – |
| Grape (Vitus sp.)3 | 1.0 | 1.7 | 2.7 | 4.5 | 7.9 |
| Grapefruit (Citrus paradisi)3 | 1.2 | 1.6 | 2.2 | 3.3 | 5.4 |
| Lemon, lime (Citrus sp.) | 1.6 | 1.6 | 2.2 | 3.2 | – |
| Orange (Citrus sinensis) | 1.1 | 1.6 | 2.2 | 3.2 | 5.3 |
| Peach (Prunus persica) | 1.1 | 1.5 | 1.9 | 2.7 | 4.3 |
| Plum, prune (Prunus domestica)3 | 1.0 | 1.4 | 1.9 | 2.9 | 4.7 |
| Strawberry (Fragaria sp.) | 0.7 | 0.9 | 1.2 | 1.7 | 2.7 |
| Walnut (Juglans regia) | 1.1 | 1.6 | 2.2 | 3.2 | – |
| 1 ECw means electrical conductivity of the irrigation water in mmhos/cm or deciSiemens per meter (dS/m). 2 The maximum tolerable ECw indicates the theoretical irrigation water salinity at which crop growth ceases. 3 Barley and wheat are less tolerant during germination and seeding stage. 4 Beets are more sensitive during germination. 5 Semi-dwarf, short cultivars may be less tolerant. | |||||
Water salinity can also adversely affect soil properties. Depending on the type of salts present, long-term use of high salinity irrigation water results in soils with high levels of salts, sodium, or salts + sodium referred to as saline soils, sodic soils, or saline-sodic soils, respectively. In general, these soils are called salt-affected soils. Growing crops on salt-affected soils requires special cultural management.

Presence of Sodium Versus Calcium and Magnesium Salts
The relative proportion of sodium (Na) to calcium (Ca) and magnesium (Mg) in irrigation water is another important aspect of evaluating its quality, often called sodicity of irrigation water. Relatively high sodium and low calcium and magnesium content are of special concern due to sodium’s adverse effects on the soil. Continued use of irrigation water with sodium in excess of calcium and magnesium leads to a very tight soil structure with poor water infiltration, poor aeration, and increased surface crusting; these conditions make tillage difficult and restrict seedling emergence and root growth, called sodium hazard. Calcium and magnesium tend to counter the adverse effects of sodium and promote good soil aggregates.
Sodium Hazard Varies With Soil Texture
Fine textured soils, especially those high in clay (smectite clay in particular), are most vulnerable to sodium hazard.
Potential sodium hazard from irrigation water is usually evaluated by an index called sodium adsorption ratio or SAR. The SAR is calculated from the ratio of the concentration of sodium to that of calcium and magnesium (Equation 1).
Equation 1:
The concentrations of sodium, calcium, and magnesium ([Na+], [Ca2+], and [Mg2+]) in Equation 1 are in milliequivalents per liter (meq/L). The conversion factors for the concentrations expressed in mg/L or ppm to meq/L are given below:
1 mg/L or 1 ppm Na = 0.0435 meq/L [Na+]
1 mg/L or 1 ppm Ca = 0.0499 meq/L [Ca2+]
1 mg/L or 1 ppm Mg = 0.0823 meq/L [Mg2+]
Bicarbonate and carbonate ions in the irrigation water increases the sodium hazard as quantified by SAR described above. This occurs because bicarbonate and carbonate ions can bind some calcium and magnesium, thereby reducing their availability to counteract the hazardous effects of sodium.
Use of Adjusted-SAR (adjRNa)
For irrigation waters containing significant amounts of bicarbonate and carbonate, the adjusted-SAR (adjRNa) should be used (instead of SAR) should be used to evaluate the potential sodium hazard.
In calculating adjusted-SAR (adjRNa), an adjusted calcium concentration ([Cax2+]) is estimated using the bicarbonate + carbonate concentration and EC of the irrigation water. Then adjRNa is calculated as shown in Equation 2.
Equation 2:
The adjRNa is a truer index of water sodicity and the risk of sodium hazard on soil properties. Because in irrigation water with significant bicarbonate + carbonate concentration, the adjusted calcium concentration ([Cax2+]) is lower than the actual calcium concentration and the adjRNa is greater than the SAR. Most adjRNa values of irrigation waters are about 10 to 15 percent greater than the unadjusted SAR.
Calculation of Adjusted Sodium Adsorption Ratio (adjRNa)
The adjusted calcium concentration ([Cax2+]) is estimated using the following procedure:
- Calculate the sum of bicarbonate [HCO3-] and carbonate [CO32-] in meq/L and consider that as just bicarbonate [HCO3-] for this calculation purpose.
- Calculate the ratio of [HCO3-] / Calcium [Ca2+] in meq/L.
- On the left side of Table 4, find the ratio nearest to the calculated [HCO3-] / Calcium [Ca2+] ratio.
- Along the top of Table 4, find the ECw nearest to the measured ECw.
- Move down the column of numbers corresponding to the ECw value until the row of numbers corresponding to the ratio is reached.
- The number at the intersection of the column and the row is the adjusted calcium concentration ([Cax2+]).
- Use this adjusted calcium concentration ([Cax2+]) to calculate the adjusted-SAR (adjRNa) using Equation 2.
| Ratio of Bicarbonate [HCO3–] / Calcium [Ca2+] | Salinity of Irrigation Water (dS/m or mmhos/cm) | |||||||||||
|---|---|---|---|---|---|---|---|---|---|---|---|---|
| 0.1 | 0.2 | 0.3 | 0.5 | 0.7 | 1.0 | 1.5 | 2.0 | 3.0 | 4.0 | 6.0 | 8.0 | |
| 0.05 | 13.20 | 13.61 | 13.92 | 14.40 | 14.79 | 15.26 | 15.91 | 16.43 | 17.28 | 17.97 | 19.07 | 19.94 |
| 0.10 | 8.31 | 8.57 | 8.77 | 9.07 | 9.31 | 9.62 | 10.02 | 10.35 | 10.89 | 11.32 | 12.01 | 12.56 |
| 0.15 | 6.34 | 6.54 | 6.69 | 6.92 | 7.11 | 7.34 | 7.65 | 7.90 | 8.31 | 8.64 | 9.17 | 9.58 |
| 0.20 | 5.24 | 5.40 | 5.52 | 5.71 | 5.87 | 6.06 | 6.31 | 6.52 | 6.86 | 7.13 | 7.57 | 7.91 |
| 0.25 | 4.51 | 4.65 | 4.76 | 4.92 | 5.06 | 5.22 | 5.44 | 5.62 | 5.91 | 6.15 | 6.52 | 6.82 |
| 0.30 | 4.00 | 4.12 | 4.21 | 4.36 | 4.48 | 4.62 | 4.82 | 4.98 | 5.24 | 5.44 | 5.77 | 6.04 |
| 0.35 | 3.61 | 3.72 | 3.80 | 3.94 | 4.04 | 4.17 | 4.35 | 4.49 | 4.72 | 4.91 | 5.21 | 5.45 |
| 0.40 | 3.30 | 3.40 | 3.48 | 3.60 | 3.70 | 3.82 | 3.98 | 4.11 | 4.32 | 4.49 | 4.77 | 4.98 |
| 0.45 | 3.05 | 3.14 | 3.22 | 3.33 | 3.42 | 3.53 | 3.68 | 3.80 | 4.00 | 4.15 | 4.41 | 4.61 |
| 0.50 | 2.84 | 2.93 | 3.00 | 3.10 | 3.19 | 3.29 | 3.43 | 3.54 | 3.72 | 3.87 | 4.11 | 4.30 |
| 0.75 | 2.17 | 2.24 | 2.29 | 2.37 | 2.43 | 2.51 | 2.62 | 2.70 | 2.84 | 2.95 | 3.14 | 3.28 |
| 1.00 | 1.79 | 1.85 | 1.89 | 1.96 | 2.01 | 2.09 | 2.16 | 2.23 | 2.35 | 2.44 | 2.59 | 2.71 |
| 1.25 | 1.54 | 1.59 | 1.63 | 1.68 | 1.73 | 1.78 | 1.86 | 1.92 | 2.02 | 2.10 | 2.23 | 2.33 |
| 1.50 | 1.37 | 1.41 | 1.44 | 1.49 | 1.53 | 1.58 | 1.65 | 1.70 | 1.79 | 1.86 | 1.97 | 2.07 |
| 1.75 | 1.23 | 1.27 | 1.30 | 1.35 | 1.38 | 1.43 | 1.49 | 1.54 | 1.62 | 1.68 | 1.78 | 1.86 |
| 2.00 | 1.13 | 1.16 | 1.19 | 1.23 | 1.26 | 1.31 | 1.36 | 1.40 | 1.48 | 1.54 | 1.63 | 1.70 |
| 2.25 | 1.04 | 1.08 | 1.10 | 1.14 | 1.17 | 1.21 | 1.26 | 1.30 | 1.37 | 1.42 | 1.51 | 1.58 |
| 2.50 | 0.97 | 1.00 | 1.02 | 1.06 | 1.09 | 1.12 | 1.17 | 1.21 | 1.27 | 1.32 | 1.40 | 1.47 |
| 3.00 | 0.85 | 0.89 | 0.91 | 0.94 | 0.96 | 1.00 | 1.04 | 1.07 | 1.13 | 1.17 | 1.24 | 1.30 |
| 3.50 | 0.78 | 0.80 | 0.82 | 0.85 | 0.87 | 0.90 | 0.94 | 0.97 | 1.02 | 1.06 | 1.12 | 1.17 |
| 4.00 | 0.71 | 0.73 | 0.75 | 0.78 | 0.80 | 0.82 | 0.86 | 0.88 | 0.93 | 0.97 | 1.03 | 1.07 |
| 4.50 | 0.66 | 0.68 | 0.69 | 0.72 | 0.74 | 0.76 | 0.79 | 0.82 | 0.86 | 0.90 | 0.95 | 0.99 |
| 5.00 | 0.61 | 0.63 | 0.65 | 0.67 | 0.69 | 0.71 | 0.74 | 0.76 | 0.80 | 0.83 | 0.88 | 0.93 |
| 7.00 | 0.49 | 0.50 | 0.52 | 0.53 | 0.55 | 0.57 | 0.59 | 0.61 | 0.64 | 0.67 | 0.71 | 0.74 |
| 10.0 | 0.39 | 0.40 | 0.41 | 0.42 | 0.43 | 0.45 | 0.47 | 0.48 | 0.51 | 0.53 | 0.56 | 0.58 |
| 20.0 | 0.24 | 0.25 | 0.26 | 0.26 | 0.27 | 0.28 | 0.29 | 0.30 | 0.32 | 0.33 | 0.35 | 0.37 |
| 30.0 | 0.18 | 0.19 | 0.20 | 0.20 | 0.21 | 0.21 | 0.22 | 0.23 | 0.24 | 0.25 | 0.27 | 0.28 |
Calculation Example
Go through the chemical analyses, the calculated SAR and the adjusted-SAR (adjRNa) of two irrigation waters in Table 5, and the calculation details underneath Table 5.
| Irrigation Water | Concentration (meq/L) | EC (mmhos/cm) | [Ca2+] (meq/L) | Calculated* | |||||
|---|---|---|---|---|---|---|---|---|---|
| Ca | Mg | Na | Carbonate | Bicarbonate | SAR | adjRNa | |||
| Water 1 | 2.32 | 1.44 | 7.73 | 0.42 | 3.66 | 1.15 | 1.43 | 5.64 | 6.45 |
| Water 2 | 0.93 | 0.50 | 11.75 | 0.88 | 5.65 | 1.50 | 0.59 | 13.90 | 15.92 |
*Note: SAR=Unadjusted SAR; adjRNa=Adjusted SAR.
Calculation Details
• Water 1
- SAR = 7.73 / ((1.44 + 2.32) / 2)1/2 = 7.73 / 1.37 = 5.64.
- Adjusted-SAR (adjRNa).
- Sum of [HCO3-] + [CO32-] = 3.66 + 0.42 = 4.08.
- [HCO3-] / [Ca2+] = 4.08 / 2.32 = 1.758.
- From Table 4, for an EC of about 1.0 dS/m and a [HCO3-] / [Ca2+] ratio of about 1.75, the [Cax2+] is 1.43 meq/L.
- Therefore, the adjusted-SAR (adjRNa) = 7.73 / ((1.44 + 1.43) / 2)1/2 = 6.45.
• Water 2
- SAR = 11.75 / ((0.93 + 0.5) / 2)1/2 = 13.90
- Adjusted-SAR (adjRNa).
- [HCO3-] / [Ca2+] = (5.65 + 0.88) / 0.93 = 7.02
- From Table 4, for a ratio of 7 and an EC of 1.5, the [Cax2+] is 1.43 meq/L.
- Therefore, the adjusted-SAR (adjRNa) = 11.75 / ((0.59 + 0.5) / 2)1/2 = 15.92.
Classification of Irrigation Water Based on SAR or adjRNa
A general classification of irrigation water based upon SAR or adjRNa values are presented in Table 6.
| SAR or adjRNa Values | Sodium Hazard of Water | Comments |
|---|---|---|
| 1—10 | LOW | Use caution on sodium sensitive crops such as avocados. |
| 10—13 | MEDIUM | Requires amendments (such as Gypsum) and leaching. |
| 18—26 | HIGH | Generally not recommended for continued use. |
| Above 26 | VERY HIGH | Generally unsuitable for irrigation. |
SAR or adjRNa and ECw
At a given SAR or adjRNa, the potential sodium hazard also depends on the salinity (ECw) of irrigation water. So SAR or adjRNa should be used in conjunction with ECw to evaluate potential sodium hazard realistically.
At any given SAR or adjRNa, as salt concentration decreases, there is a higher sodium hazard leading to reduced permeability of soils (Table 7).
| Potential Irrigation Water Quality Problem | Units | Degree of Restriction on Use | ||
|---|---|---|---|---|
| None | Slight to Moderate | Severe | ||
| Specific Ion Toxicity (affects sensitive crops) | ||||
| Sodium (Na)1 | ||||
| Surface irrigation | mg/L or ppm | < 3 | 3–9 | > 9 |
| Sprinkler irrigation | mg/L or ppm | < 69 | > 69 | |
| Chloride (Cl)1 | ||||
| Surface irrigation | mg/L or ppm | < 142 | 142–355 | > 355 |
| Sprinkler irrigation | mg/L or ppm | < 106 | > 106 | |
| Boron (B)2 | mg/L or ppm | < 0.7 | 0.7–3.0 | > 3.0 |
| Miscellaneous Effects (affects susceptible crops) | ||||
| Nitrogen (NO3 – N)3 | mg/L or ppm | < 5 | 5–30 | > 30 |
| Bicarbonate (HCO3) (overhead sprinkling only) | mg/L or ppm | < 92 | 92–519 | > 519 |
| pH | Normal Range 6.5–8.4 | |||
| 1 For surface irrigation, most tree crops and woody plants are sensitive to sodium and chloride; use the values shown. Most annual crops are NOT sensitive; use the salinity tolerance table (Table 3). For sodium and chloride tolerance of some selected crops, see Tables 9 and 10. With overhead sprinkler irrigation and low humidity (< 30 percent), sodium and chloride may be absorbed through the leaves of sensitive crops; for crop sensitivity to such absorption, see Table 10. 2 For boron tolerances see Table 11. 3 Nitrate-N means nitrate nitrogen reported in terms of elemental nitrogen (Ammonia-N and Organic-N should be included when wastewater is being tested for potential irrigation use). | ||||
Soluble sodium percentage (SSP) in irrigation water is also used to evaluate its sodium hazard. The SSP is defined as the ratio of sodium in meq/L to the sum of all cations in meq/L multiplied by 100. An irrigation water with SSP greater than 60 percent may result in accumulation of sodium that will cause sodium hazards on soil properties as described earlier.
pH and Alkalinity
The pH value of water indicates whether it is acidic (pH < 7.0), neutral (pH ≈ 7.0), or alkaline (pH > 7.0). The normal pH range for irrigation water is 6.5 to 8.4 (Table 8). Acidic water (pH < 5.5) may cause accelerated corrosion of irrigation system.
Water with a high pH (> 8.5) is often caused by the presence of high amounts of bicarbonate and carbonate, known as alkalinity. High bicarbonate + carbonate binds calcium and magnesium ions and forms insoluble minerals. This enhances the hazardous effect of sodium on soil permeability. Thus alkaline water could intensify sodium hazard. In such cases, an adjusted SAR (adjRNa) value rather than an ordinary SAR value, as discussed earlier, should be used to evaluate the potential sodium hazard. On the other hand, irrigation water with high pH and alkalinity may have some beneficial effects on the acidic soils of Georgia. However, this potential benefit has not yet been evaluated.
Specific Ion Toxicity and Miscellaneous Effects
In addition to salinity hazard and sodium hazard described earlier, saline irrigation water may lead to concentrations of some elements high enough to cause crop damage and reduce yields of sensitive crops, known as Specific Ion Toxicity. Sodium, chloride, and boron are of the most concern in this regard. Although these elements are essential to plants in very low amounts, they can cause toxicity to sensitive crops at high concentrations (Tables 8 and 9).
| Potential Irrigation Water Quality Problem | Units | Degree of Restriction on Use | ||
|---|---|---|---|---|
| None | Slight to Moderate | Severe | ||
| Specific Ion Toxicity (affects sensitive crops) | ||||
| Sodium (Na)1 | ||||
| Surface irrigation | mg/L or ppm | < 3 | 3–9 | > 9 |
| Sprinkler irrigation | mg/L or ppm | < 69 | > 69 | |
| Chloride (Cl)1 | ||||
| Surface irrigation | mg/L or ppm | < 142 | 142–355 | > 355 |
| Sprinkler irrigation | mg/L or ppm | < 106 | > 106 | |
| Boron (B)2 | mg/L or ppm | < 0.7 | 0.7–3.0 | > 3.0 |
| Miscellaneous Effects (affects susceptible crops) | ||||
| Nitrogen (NO3 – N)3 | mg/L or ppm | < 5 | 5–30 | > 30 |
| Bicarbonate (HCO3) (overhead sprinkling only) | mg/L or ppm | < 92 | 92–519 | > 519 |
| pH | Normal Range 6.5–8.4 | |||
| 1 For surface irrigation, most tree crops and woody plants are sensitive to sodium and chloride; use the values shown. Most annual crops are NOT sensitive; use the salinity tolerance table (Table 3). For sodium and chloride tolerance of some selected crops, see Tables 9 and 10. With overhead sprinkler irrigation and low humidity (< 30 percent), sodium and chloride may be absorbed through the leaves of sensitive crops; for crop sensitivity to such absorption, see Table 10. 2 For boron tolerances see Table 11. 3 Nitrate-N means nitrate nitrogen reported in terms of elemental nitrogen (Ammonia-N and Organic-N should be included when wastewater is being tested for potential irrigation use). | ||||
| Sensitive | Semi-Tolerant | Tolerant |
|---|---|---|
| Avocado (Persea americana) | Carrot (Daucus carota) | Alfalfa (Medicago sativa) |
| Deciduous Fruits | Clover, ladino (Trifolium repens) | Barley (Hordeum vulgare) |
| Nuts | Dallisgrass (Paspalum dilatatum) | Beet, garden (Beta vulgaris) |
| Bean, green (Phaseolus vulgaris) | Tall fescue (Festuca arundinacea) | Beet, sugar (Beta vulgaris) |
| Cotton (at germination) (Gossypium hirsutum) | Lettuce (Lactuca sativa) | Bermuda grass (Cynodon dactylon) |
| Corn (Zea mays) | Bajara (Pennisetum typhoides) | Cotton (Gossypium hirsutum) |
| Peas (Pisum sativum) | Sugarcane (Saccharum officinarum) | Paragrass (Brachiaria mutica) |
| Grapefruit (Citrus paradisi) | Berseem (Trifolium alexandrinum) | Rhodes grass (Chloris gayana) |
| Orange (Citrus sinensis) | Benji (Melilotus parviflora) | Wheatgrass, crested (Agropyron cristatum) |
| Peach (Prunus persica) | Raya (Brassica juncea) | Wheatgrass, fairway (Agropyron cristatum) |
| Tangerine (Citrus reticulata) | Oat (Avena sativa) | Wheatgrass, tall (Agropyron elongatum) |
| Mung bean (Phaseolus aurus) | Onion (Allium cepa) | Karnal grass (Diplachna fusca) |
| Lentil (Lens culinaris) | Radish (Raphanus sativus) | |
| Groundnut (peanut) (Arachis hypogaea) | Rice (Oryza sativus) | |
| Chickpea (Cicer arietinum) | Rye (Secale cereale) | |
| Cowpeas (Vigna sinensis) | Ryegrass, Italian (Lolium multiflorum) | |
| Sorghum (Sorghum vulgare) | ||
| Spinach (Spinacia oleracea) | ||
| Tomato (Lycopersicon esculentum) | ||
| Vetch (Vicia sativa) | ||
| Wheat (Triticum vulgare) |
Overhead Irrigation vs. Surface Irrigation
Overhead sprinkling on sensitive crops can cause toxicities not encountered when the same water is applied by surface or drip (surface or sub-surface) irrigation methods. The toxicity occurs due to excessive quantities of sodium and chloride from the irrigation water being absorbed through plant leaves. Extreme damage may include severe leaf burn and defoliation.
Toxicity to sensitive crops occurs at relatively low sodium or chloride concentrations (> 3 meq/L). Most annual crops are not sensitive, but they will also be damaged if concentrations are high enough. Absorption and toxicity occur mostly during periods of high temperature and low humidity (< 30 percent), and the problem is frequently made worse by windy conditions. Rotating sprinkler heads present the greatest risk. Between rotations, water evaporates and the salts become more concentrated in the shrinking volume of water. Crop tolerances to sodium and chloride in sprinkler-applied irrigation water are not well established due to limited data and the pronounced influence of climatic conditions. Table 10 gives some rough estimates.
Leaf burn under sprinkler from both sodium and chloride can be reduced by irrigating at nighttime or on cool, cloudy days. Drop nozzles and drag hoses are also recommended when applying any saline irrigation water through a sprinkler system to avoid direct contact with leaf surfaces.
| Concentrations Causing Foliar Injury2 | |||
|---|---|---|---|
| meq/L: < 5 (Na+ or Cl-) mg/L or ppm: Na+: < 115 Cl-: < 177 | meq/L: 5–10 (Na+ or Cl-) mg/L or ppm: Na+: 115–230 Cl-: 177–354 | meq/L: 10–20 (Na+ or Cl-) mg/L or ppm: Na+:230–460 Cl-: 354–708 | meq/L: 20 (Na+ or Cl-) mg/L or ppm: Na+: > 460 Cl-: > 708 |
| Almond (Prunus dulcis) | Grape (Vitis spp.) | Alfalfa (Medicago sativa) | Cauliflower (Brassica oleracea) |
| Apricot (Prunus armeniaca) | Pepper (Capsicum annuum) | Barley (Hordeum vulgare) | Cotton (Gossypium hirsutum) |
| Citrus (Citrus sp.) | Potato (Solanum tuberosum) | Corn (maize) (Zea mays) | Sugarbeet (Beta vulgaris) |
| Plum (Prunus domestica) | Tomato (Lycopersicon lycopersicum) | Cucumber (Cucumis sativus) Safflower (Carthamus tinctorius) Sesame (Sesamum indicum) Sorghum (Sorghum bicolor) | Sunflower (Helianthus annuus) |
| 1 Susceptibility based on direct accumulation of salts through the leaves. For some crops, the concentration given may exceed the overall salinity tolerance of that crop and cause some reduction in yield in addition to that caused by chloride ion toxicities. 2 Leaf absorption and foliar injury are influenced by cultural and environmental conditions such as drying winds, low humidity, speed of rotation of sprinklers, and the timing and frequency of irrigations. Data presented are only general guidelines for late spring and summer daytime sprinkling. | |||
Boron Toxicity
Boron may be toxic on sensitive crops at concentrations lower than 1.0 ppm in irrigation water (Table 11). Because boron toxicity can occur at such low concentrations, testing boron in irrigation water is recommended before applying additional boron to crops.
| Tolerance Category | Common Name | Scientific Name |
|---|---|---|
| Very Sensitive (< 0.5 mg/L) | Lemon | Citrus limon |
| Very Sensitive (< 0.5 mg/L) | Blackberry | Rubus spp. |
| Sensitive (0.5–0.75 mg/L) | Avocado | Persea americana |
| Sensitive (0.5–0.75 mg/L) | Grapefruit | Citrus X paradisi |
| Sensitive (0.5–0.75 mg/L) | Orange | Citrus sinensis |
| Sensitive (0.5–0.75 mg/L) | Apricot | Prunus armeniaca |
| Sensitive (0.5–0.75 mg/L) | Peach | Prunus persica |
| Sensitive (0.5–0.75 mg/L) | Cherry | Prunus avium |
| Sensitive (0.5–0.75 mg/L) | Plum | Prunus domestica |
| Sensitive (0.5–0.75 mg/L) | Persimmon | Diospyros kaki |
| Sensitive (0.5–0.75 mg/L) | Fig, kadota | Ficus carica |
| Sensitive (0.5–0.75 mg/L) | Grape | Vitis vinifera |
| Sensitive (0.5–0.75 mg/L) | Walnut | Juglans regia |
| Sensitive (0.5–0.75 mg/L) | Pecan | Carya illinoiensis |
| Sensitive (0.5–0.75 mg/L) | Cowpea | Vigna unguiculata |
| Sensitive (0.5–0.75 mg/L) | Onion | Allium cepa |
| Sensitive (0.75–1.0 mg/L) | Garlic | Allium sativum |
| Sensitive (0.75–1.0 mg/L) | Sweet potato | Ipomoea batatas |
| Sensitive (0.75–1.0 mg/L) | Wheat | Triticum eastivum |
| Sensitive (0.75–1.0 mg/L) | Barley | Hordeum vulgare |
| Sensitive (0.75–1.0 mg/L) | Sunflower | Helianthus annuus |
| Sensitive (0.75–1.0 mg/L) | Bean, mung | Vigna radiata |
| Sensitive (0.75–1.0 mg/L) | Sesame | Sesamum indicum |
| Sensitive (0.75–1.0 mg/L) | Lupine | Lupinus hartwegii |
| Sensitive (0.75–1.0 mg/L) | Strawberry | Fragaria spp. |
| Sensitive (0.75–1.0 mg/L) | Artichoke, Jerusalem | Helianthus tuberosus |
| Sensitive (0.75–1.0 mg/L) | Bean, kidney | Phaseolus vulgaris |
| Sensitive (0.75–1.0 mg/L) | Bean, lima | Phaseolus lunatus |
| Sensitive (0.75–1.0 mg/L) | Groundnut/peanut | Arachis hypogaea |
| Moderately Sensitive (1.0–2.0 mg/L) | Pepper, red | Capsicum annuum |
| Moderately Sensitive (1.0–2.0 mg/L) | Pea | Pisum sativa |
| Moderately Sensitive (1.0–2.0 mg/L) | Carrot | Daucus carota |
| Moderately Sensitive (1.0–2.0 mg/L) | Radish | Raphanus sativus |
| Moderately Sensitive (1.0–2.0 mg/L) | Potato | Solanum tuberosum |
| Moderately Sensitive (1.0–2.0 mg/L) | Cucumber | Cucumis sativus |
| Moderately Tolerant (2.0–4.0 mg/L) | Lettuce | Lactuca sativa |
| Moderately Tolerant (2.0–4.0 mg/L) | Cabbage | Brassica oleracea capitata |
| Moderately Tolerant (2.0–4.0 mg/L) | Celery | Apium graveolens |
| Moderately Tolerant (2.0–4.0 mg/L) | Turnip | Brassica rapa |
| Moderately Tolerant (2.0–4.0 mg/L) | Bluegrass, Kentucky | Poa pratensis |
| Moderately Tolerant (2.0–4.0 mg/L) | Oats | Avena sativa |
| Moderately Tolerant (2.0–4.0 mg/L) | Maize | Zea mays |
| Moderately Tolerant (2.0–4.0 mg/L) | Artichoke | Cynara scolymus |
| Moderately Tolerant (2.0–4.0 mg/L) | Tobacco | Nicotiana tabacum |
| Moderately Tolerant (2.0–4.0 mg/L) | Mustard | Brassica juncea |
| Moderately Tolerant (2.0–4.0 mg/L) | Clover, sweet | Melilotus indica |
| Moderately Tolerant (2.0–4.0 mg/L) | Squash | Cucurbita pepo |
| Moderately Tolerant (2.0–4.0 mg/L) | Muskmelon | Cucumis melo |
| Tolerant (4.0–6.0 mg/L) | Sorghum | Sorghum bicolor |
| Tolerant (4.0–6.0 mg/L) | Tomato | Lycopersicon lycopersicum |
| Tolerant (4.0–6.0 mg/L) | Alfalfa | Medicago sativa |
| Tolerant (4.0–6.0 mg/L) | Vetch, purple | Vicia benghalensis |
| Tolerant (4.0–6.0 mg/L) | Parsley | Petroselinum crispum |
| Tolerant (4.0–6.0 mg/L) | Beet, red | Beta vulgaris |
| Tolerant (4.0–6.0 mg/L) | Sugarbeet | Beta vulgaris |
| Very Tolerant (6.0–15.0 mg/L) | Cotton | Gossypium hirsutum |
| Very Tolerant (6.0–15.0 mg/L) | Asparagus | Asparagus officinalis |
| 1 Maximum concentrations tolerated in soil-water or saturation extract without yield or vegetative growth reductions. Boron tolerances vary depending upon climate, soil conditions and crop varieties. Maximum concentrations in the irrigation water are approximately equal to these values or slightly less. | ||
Miscellaneous Effects
Other problems associated with irrigation water include reductions in crop yield and quality due to excessive nutrients; hindered marketability due to unsightly deposition of excessive nutrients on fruit or foliage; and increased maintenance and repair costs due to clogging or excessive corrosion of equipment. Irrigation waters high in nitrogen—when applied with recommended dose of N fertilizer—can cause quality problems in crops, such as malting barley and sugar beets, and excessive vegetative growth in some vegetables. However, good fertilizer and irrigation water management can usually solve these problems. Irrigation water nitrate-nitrogen should be credited toward the fertilizer rate especially when the concentration exceeds 10 ppm nitrate-nitrogen (or 45 ppm nitrate). Table 12 includes some useful irrigation water quality criteria to assess the clogging potential in drip irrigation systems.
| Water Quality Criteria | Unit | Degree of Restriction to Use | ||
|---|---|---|---|---|
| None | Slight to Moderate | Severe | ||
| Physical | ||||
| Total suspended solids (TSS) | mg/L | < 50 | 50–100 | > 100 |
| Chemical | ||||
| pH | none | < 7.0 | 7.0–8.0 | > 8.0 |
| Total dissolved solids (TDS) | mg/L | < 500 | 500–2,000 | > 2,000 |
| Manganese (Mn) | mg/L | < 0.1 | 0.1–1.5 | > 1.5 |
| Iron (Fe) | mg/L | < 0.1 | 0.1–1.5 | > 1.5 |
| Hydrogen sulfide (H2S) | mg/L | < 0.5 | 0.5–2.0 | > 2.0 |
| Bacteria | MPN/mL1 | < 10,000 | 10,000–50,000 | > 50,000 |
| 1 MPN = Most Probable Number | ||||
Bacteria in Irrigation Water
The water used for irrigation and crop protection (spraying insecticides and herbicides) by the producers of fresh fruits and vegetables in Georgia are required to meet the specifications set by Good Agricultural Practices (GAP) audit by the Georgia Department of Agriculture (GDA) sanctioned in 2005. A key area of the Georgia GAP audit is bacteriological water quality compliance. The main goal of irrigation water quality compliance in this regard is to ensure the required bacteriological quality of water used in Georgia for irrigation and crop protection that could allow growers to make informed decisions on how to use their water safely. However, standards for this have not yet been developed and implemented by the state.
In the absence of a state approved standard, the microbial quality of irrigation water is being evaluated following “The Commodity Specific Food Safety Guidelines for the Production and Harvest of Lettuce and Leafy Greens” (July/10/2009). The guidelines recommend:
- The geometric mean of five consecutive samples (collected at least 18 hours and at most 30 days apart) tested for the bacterium Escherichia coli (E. coli) should not exceed 126 MPN/100 mL for both foliar and non-foliar applications.
- When the sampling criteria for the geometric mean, stated above, are followed and the recommended level for the geometric mean is met, any single sample E. coli level should not exceed 235 MPN/100 mL for foliar application (sprinkler) and 576 MPN/100 mL for non-foliar application (drip/furrow).
However, given the absence of any government adopted standards, the actual acceptance of the results relies entirely on the policy of the auditing body.
Calculation of Geometric Mean
The geometric mean of the observations X1, X2, X3 ……………Xn is given by:
Suppose, you collected five water samples at least 18 hours and at most 30 days apart, tested them for E. coli, and you found these concentrations:
| Sample Number | E. coli (MPN or CFU per 100 mL)1 |
|---|---|
| 1 | 10 |
| 2 | 100 |
| 3 | 300 |
| 4 | 15 |
| 5 | 4 |
| 1 MPN = Most Probable Number; CFU = Colony Forming Unit. MPN and CFU are interchangeably used and interpreted on the same standard. | |
The geometric mean for these data is as follows:
IMPORTANT NOTE: The U.S. Food and Drug Administration (FDA) Food Safety Modernization Act (FSMA) was signed into law by the president on January 4, 2011. The FDA, Center for Food Safety (CFS), and the Center for Environmental Health (CEH) are going to publish the final rules pertinent to produce safety required for implementing the FSMA in this regard. These rules will include the “Standards Directed to Agricultural Water” within the “Standards for the Growing, Harvesting, Packing, and Holding of Produce for Human Consumption.” This section will be revised based on the final rules once they are published.
Summary
The nature and extent of irrigated agriculture has changed with respect to water quantity and quality over the past 30 years. In fact, irrigated acreage in Georgia has increased tremendously and is expected to surpass 1.65 million irrigated acres by 2050. With this increase in water use, the availability of water and the quality of water will continue to be a concern in the coming years. Producers must take this into consideration when planning and using irrigation systems.
Understanding irrigation water quality is critical to making management decision for long-term productivity since it can have a significant effect on crop yield, physical condition of the soil, soil salinity, fertility needs, irrigation system performance (and longevity), and water application methods. In some cases, the quality of irrigation water can influence crop productivity more than soil fertility, plant cultivar, or weed control. Maintaining water quality in an irrigation system is vital to the system’s effectiveness and can mean the difference between a below average yield and a bumper crop.
Glossary of Terms (Adapted from Hanson et al., 2006)
Electrical conductivity. Defines the extent to which water conducts electricity, which is proportional to the concentration of dissolved salts present and is used as an estimator of the total dissolved salts in soil water.
Electrical conductivity is expressed in millimhos per centimeter (mmhos/cm) or decisiemens per meter (dS/m):
ECe = electrical conductivity of the saturated soil extract.
ECi, ECiw, or ECw = electrical conductivity of the irrigation water.
ECsw = electrical conductivity of the soil water.
Saline soil. Soil affected by excessive salts.
Saline-sodic soil. Soil affected by both excessive salts and excessive sodium.
Salinity hazard. Inadequate water uptake by plants due to high salts concentration in soil water.
Salinity. The measure of salt contained in soil or water.
Sodic Soil. Soil affected by excessive sodium.
Sodicity. Condition in which the salt composition of the soil or water is dominated by sodium, which affects soil structure and water infiltration.
Sodium adsorption ratio (SAR). Relationship between the concentration of sodium ([Na+]) in the irrigation water relative to the concentrations of calcium ([Ca2+]) and magnesium ([Mg2+]), expressed in meq/L as follows:
Sodium hazard. Reduction or loss of water permeability of soil due to destruction of soil structure caused by excessive sodium relative to calcium and magnesium.
Specific-ion toxicity. Injury to the plant caused by a specific constituent in irrigation water, usually chloride, boron, or sodium, which has accumulated in a particular part of the plant, such as leaves and stems.
Total dissolved solids (TDS). A measure of the dissolved solids in soil water, expressed in either parts per million or milligrams per liter, used to estimate the relative salinity hazard of the water.
For more information on irrigation water quality, contact your local Cooperative Extension agent at 1-800-ASK-UGA1.
Sources
Abrol, I. P. (1982, May). Technology of chemical, physical and biological amelioration of deteriorated soils. Presented at Panel of Experts on Amelioration and Development of Deteriorated Soils in Egypt, Cairo.
Ayres, R. S., & Westcot, D. W. (1985). Water quality for agriculture (FAO Irrigation and Drainage Paper No. 29 Rev. 1). Rome: Food and Agriculture Organization of the United Nations.
Bauder, T. A., Waskom, R. M., & Davis, J. G. (2014). Irrigation water quality criteria (Fact Sheet No. 0.506). Retrieved from Colorado State University Extension website: https://extension.colostate.edu/docs/pubs/crops/00506.pdf
Bauder, J. W., Bauder, T. A., Waskom, R. M., & Scherer, T. F. (n.d.). Assessing the suitability of water (quality) for irrigation – salinity and sodium. Northern Plains and Mountains Regional Water Program. https://region8water.colostate.edu/PDFs/Assessing%20the%20Suitablity%20of%20Water%20Quality%20for%20Irrigation.pdf
California Fertilizer Association. (1995). Western fertilizer handbook (8th ed.). Danville, IL: Interstate Publishers.
FAO/Unesco. (1973). Irrigation, drainage and salinity: an international sourcebook. London: Paris/Unesco/Hutchinson & Co. LTD.
Fipps, G. (2003). Irrigation water quality standards and salinity management (B-1667). College Station, TX: Texas A&M Agrilife Extension.
Hanson, B. R., Grattan, S. R., & Fulton, A. (1999). Agricultural salinity and drainage (Division of Agriculture and Natural Resources Publication 3375) (Rev. 2006). Davis, CA: University of California, Davis.
Maas, E. V. (1987). Salt tolerance of plants. In B. R. Christie (Ed.), CRC handbook of plant science in agriculture (pp. 57-75). Boca Raton, FL: CRC Press. https://doi.org/10.1201/9780429286735-2
Miller, R. W., & Gardiner, D. T. (2000). Soils in our environment (9th ed., pp. 452). Upper Saddle River, NJ: Prentice Hall, Inc.
Nakayama, F. S. (1982, February). Water analysis and treatment to control emitter plugging. In Proceedings of Irrigation Association Conference, Portland, OR.
Pearson, G. A. (1960). Tolerance of crops to exchangeable sodium (Agriculture Information Bulletin No. 216). Washington, DC: U. S. Department of Agriculture.
Pescon, M. B. (1992). Wastewater treatment and use in agriculture (FAO Irrigation and Drainage Paper No. 47). Rome: Food and Agriculture Organization of the United Nations.
Rhoads, J. D., Kandiah, A., & Mashali, A.M. (1992). The use of saline waters for crop production. (FAO Irrigation and Drainage Paper No. 48). Rome: Food and Agriculture Organization of the United Nations.