
With rising energy costs to pump irrigation water, it is increasingly important that irrigation systems apply water uniformly in order to maximize the benefits of irrigation. When irrigation systems are used to apply fertilizers and pesticides, application uniformity becomes even more critical. Consequently, it is important for center pivot owners and operators to periodically check the uniformity of their systems.
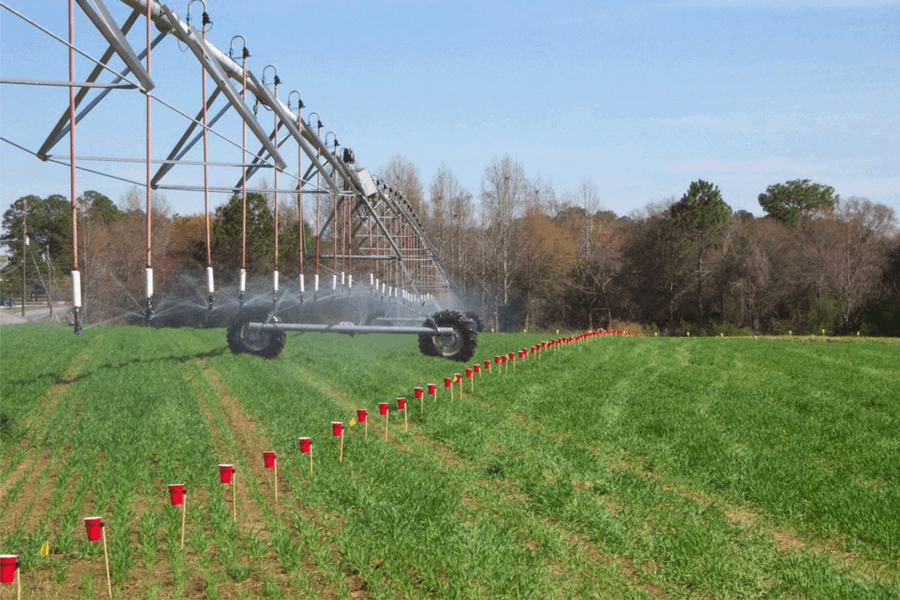
The uniformity of water application under a center pivot is determined by placing buckets or rain gauges along the length of the pivot at a known and uniform interval, bringing the irrigation system up to a standard operating pressure, and letting the system pass over them (Figure 1). Record the distance from the center of the pivot and the amount of water collected for each bucket or gauge. It is critical that the catch-cup opening and actual caught volume are accurately calculated before entering the data.

Once these data are entered into an appropriate data sheet or spreadsheet, a coefficient of uniformity can be calculated. The coefficient of uniformity is usually expressed as a percentage. Interpretation of these values is discussed later. Water can be collected by several means, as shown in Figures 1 and 2.

Methods and Formulas
Several methods or formulas can be used for determining irrigation application uniformity. Certain methods are preferred for different types of irrigation systems.
Christiansen Uniformity Coefficient
For a center-pivot irrigation system, the easiest and most widely used formula is the Christiansen Uniformity coefficient. The mathematical equation for the Christiansen Uniformity coefficient is:
CU = 100 [1 – (A/B)]
Where CU is the Christiansen Coefficient, A is the sum of the absolute value of the deviation of the average catch-cup value from each individual catch-cup data point, and B is the sum of the catch-cup observations.
Heerman and Hein Uniformity Coefficient
A second method/formula specifically for center pivots is the Heerman and Hein Uniformity coefficient. It is the method recommended by the American Society of Agricultural and Biological Engineers (ANSI/ASAE S436.2). It is very mathematically involved and requires the use of a computer in most cases. There are multiple computer programs available that can do the lengthy and involved calculations for you. You can even use Microsoft Excel to develop your own data analysis.
Mobile Irrigation Lab Evaluation
UGA Extension offers free pivot uniformity evaluations on farms. Contact your local UGA county Extension agent and work with them to get a Mobile Irrigation Lab (MIL) evaluation performed on your farm. If there are multiple pivots and a producer would like to perform tests on his own, UGA Extension can enter the data collected and supply uniformity results.
Analyzing the Data
For a simple “do-it-yourself ” approach to analyzing pivot uniformity, a simple plot of the data will reveal the places along the pivot where “high” or “low” applications have occurred (Figures 3 and 4).
Figure 3 is an example of a system where only certain sprinklers need attention. The calculated uniformity coefficient was 83% (see Table 1 at end of this resource for additional explanation about interpreting the uniformity coefficient). While this coefficient is acceptable, it could still be improved by correcting the high application at/near the 720-ft distance. When this correction was made, the uniformity coefficient improved to 86%.
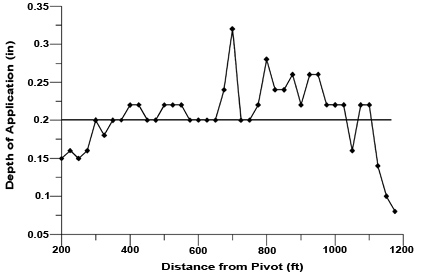

Figure 3. Plot of uniformity data with minor nozzle problems.
Initially, Figure 4 may appear to be more uniform because it does not have major leaks or stopped-up nozzles, but it is an example of a system that needs new nozzles or sprinklers to correct the uniformity problem. The “high” and “low” application amounts are at several locations along the system, making individual sprinkler replacement too involved. The calculated uniformity coefficient for this system was 78%. The recommendation was made to “renozzle” the system.
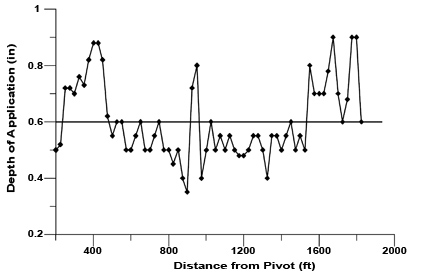

Figure 4. Plot of uniformity data with major nozzle problems.
Appropriate Containers for the Uniformity Test
Rain gauges, 16-oz drink cups, paint buckets, or other containers of uniform size may be used to perform a uniformity test. If rain gauges are used, the amount collected may be recorded directly in inches. If other containers are used, the volume collected can be determined by pouring the contents into a small graduated cylinder calibrated in milliliters. This volume can then be converted to inches of depth by measuring the inside diameter (in inches) of the top of a round container and calculating a conversion factor as follows:
C.F. = 12.87 x D x D
C.F. is the conversion factor and D is the inside diameter of the catch cup in inches. By dividing the amount of water collected in milliliters by this conversion factor, the depth in inches may be determined.
Performing the Test
The basic materials necessary to perform a uniformity test are catch containers, a tape measure or roll tape, stopwatch, flags to assist in last tower speed measurement, a liquid measuring device (if not using rain gauges), and a worksheet to record the data. The agencies mentioned earlier could loan you these materials, or they could help you perform the test.
Place the cans or rain gauges in a straight line from the pivot point. This line of gauges should be about 30 to 45 degrees “ahead” of the direction that the pivot will travel so water will not enter the gauges during the initial pivot startup.
Place the first gauge about 40 ft from the pivot point. It is not necessary to place gauges any closer to the pivot point than this because the uniformity under the first tower is usually not good, and the area represented is small (less than 3 acres). Place gauges no more than 50 ft apart from this beginning point.
We recommend that the gauge spacing is comparable to the sprinkler spacing on the pivot. A 10- to 30-ft spacing usually is preferred. On pivots less than two spans, 10-ft spacing is highly recommended. Placing the gauges closer together provides a more accurate representation of the application uniformity. If the end gun will be operating, continue to place cans extending about 150 ft past the end gun. This will ensure that gauges are located under the full throw of the end gun.
Once the gauges are in place, bring the pivot up to normal operating pressure and then operate (forward or reverse direction) to pass over the gauges completely. The speed of the pivot (percentage timer setting) selected for this application is critical. Operation at the normal percentage timer setting will tell the operator whether the system is applying the amount of water that is desired. If the amount of water caught is not equal to the timer setting, then a pivot calibration should be performed and new application chart developed.
Remember that performing a uniformity test on a hot, dry, windy day may result in evaporation losses as high as 25%. If time is critical, the uniformity test may be performed at a higher percentage timer setting. This will allow the pivot to pass over the gauges more quickly. As the pivot is moving, travel the length of the pivot and look for leaks and sprinklers that may not be rotating or operating properly. Make a note of these locations on the back of the data sheet. These notes will help you make recommendations for improvements.
After the pivot has passed over the gauges, record in your spreadsheet/worksheet the distance of each gauge from the pivot and the depth or volume of water collected in each gauge. When calculating the uniformity coefficient, disregard all gauges at the end of the system in which the volume of water collected begins to drop drastically.
Basic Interpretation of Uniformity Coefficients
(can be applied to either Christiansen or Heerman & Hein calculations)
90 to 100 — Excellent; no changes required.
85 to 90 — Good; no changes required unless a problem area is obvious.
80 to 85 — Fair; no improvements needed but system should be monitored closely.
Below 80 — Poor; improvements needed, particularly if chemicals are to be injected.
Possible Causes of Poor Uniformity
| Common Problems | Correction Measures |
| Clogged nozzles | Remove and clean nozzles. |
| Sprinklers not turning | Repair or replace sprinklers with correct sprinklers according to the design of the sprinkler package. Could also be caused by inadequate pressure. |
| Inadequate system pressure** | Increase pressure if possible. If this is not possible, the pivot should be retrofitted with a new sprinkler package to match the flow and pressure needed to achieve a good spray pattern. Inspect your well performance for pump wear. |
| Elevation differences | Pressure regulators may be required. |
| Sprinkler in wrong order** | Obtain printout from manufacturer and install sprinklers correctly. |
| End gun not adjusted properly | Adjust part circle stops on end gun according to the design settings. |
| Wrong or missing end gun nozzle** | Place the correct nozzle on end gun per the design. |
| Worn nozzles** | Replace sprinkler nozzles with the newest updated design package. (Some older pivots have updated design packages, even if using the same type of nozzle.) |
| Excessive wind* | Check uniformity while wind velocity is low. |
| Excessive water in cup | Look for possibility of water “channeling” down a pivot support structure or a leak at that location. |
| * It is not recommended to conduct a uniformity catch can test when wind velocities exceed 10 mph. Winds should be less than 5 mph to obtain representative results. ** These items may need irrigation dealer input. | |
The original manuscript was prepared by Kerry Harrison and Calvin Perry. Revised in 2022 by Wesley Porter, David Hall, Jason Mallard, and Calvin Perry. Later revised by Wesley Porter, Jason Mallard, Phillip Edwards, David Hall, Savannah Beasley, Amilcar Vargas, and B.J. Washington, Department of Crop and Soil Sciences.