An additional author is John Hudson May, UGA College of Engineering graduate.
Why is Streamflow Important and Why Should We Monitor It?
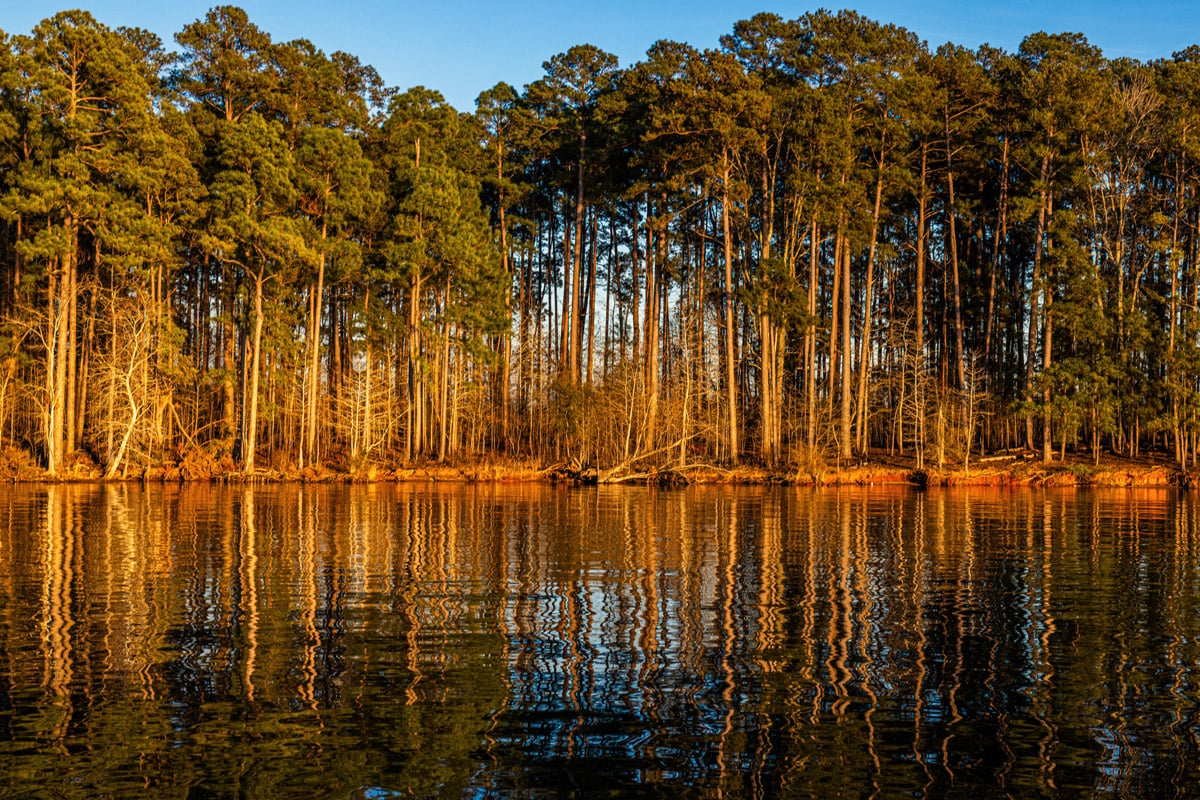
Streamflow is the rate at which water moves in a stream. Knowing the rate of water movement is important because it is a factor that can define the shape, size, and course of a stream over time. Streamflow is influenced by both forces of nature and humans.
Agricultural Impacts on Streamflows
Agricultural irrigation has an impact on streamflow and normally occurs during warm, dry months of the year when pumping water from surface sources such as streams and rivers is at its highest. This pumping for irrigation can contribute to a rapid depletion of the streamflow. Development of farm, timber, or pastureland may change the landscapes in a watershed and alter the streamflow of a stream. Monitoring the streamflow over time helps us better understand the natural flow rate over time.
Low Flow Plans
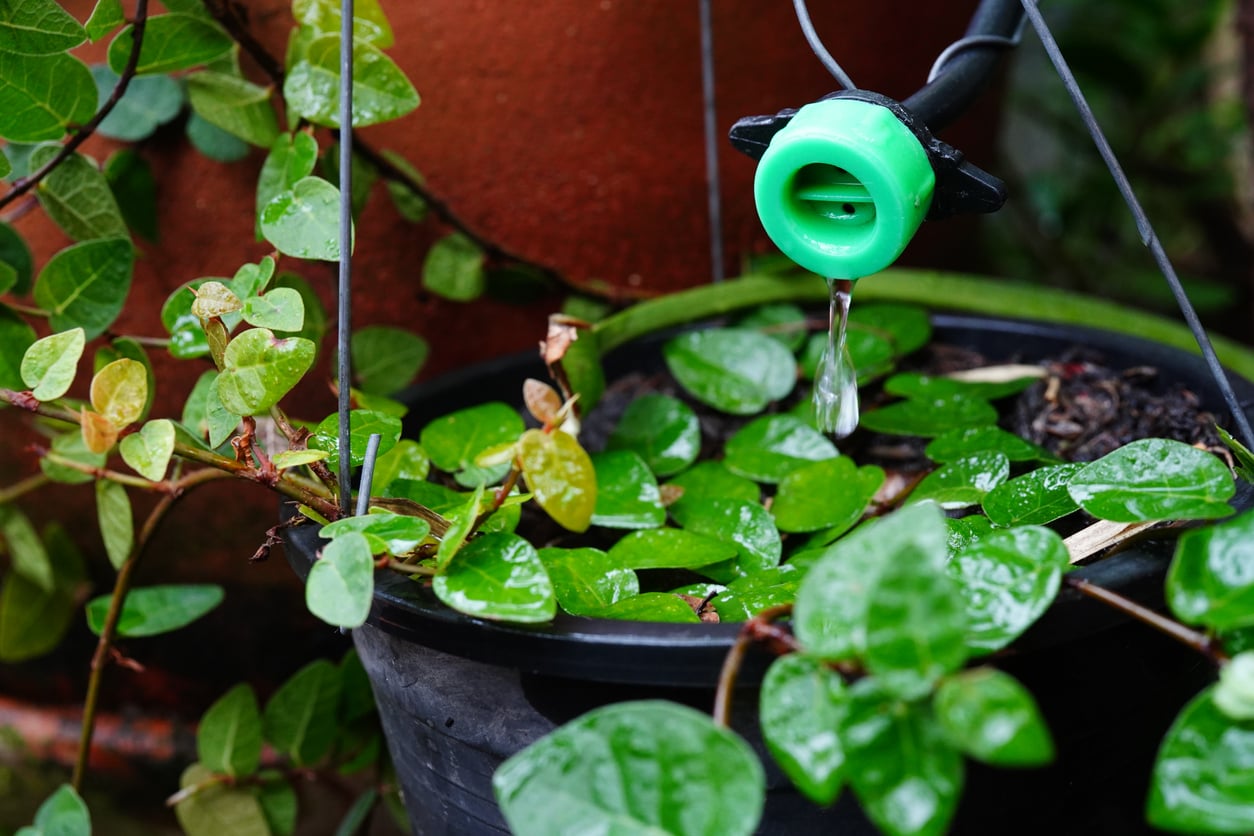
A low flow plan is designed to assist farmers to efficiently oversee their own water availability and use, improve the productivity and efficiency of irrigation systems, and perfect water scheduling to meet crop needs and protect streamflow.
The Environmental Protection Division (EPD) of Georgia’s Department of Natural Resources is charged with regulating the state’s water resources and requires a low flow plan in irrigation permits to protect environmental and ecosystem health associated with maintaining a minimum flow in a stream.
“Low flow” for any creek or stream will be defined by the EPD Agricultural Permitting Group based on the watershed conditions of the specific creek or stream being used for surface water withdrawals requiring a low flow plan. The following describes one method of measuring the streamflow known as the bucket method.
The Bucket Method
The bucket method is the simplest and most cost-efficient means for measuring streamflow on a small stream. This method involves capturing all of the stream’s water into a container that has a known volume (e.g., a bucket) and recording the time it takes for the container to fill up. The technique is based on the continuity equation, which simply states that through a control volume (such as the bucket), the amount entering the volume equals that of the amount exiting. Therefore, it is important to ensure that most, if not all, of the streamflow enters the container during the measurement period.
Items Needed
The items needed for the bucket method include:
- a large container of known volume
- a bottle or a small container of known volume
- timer
- recordkeeping materials (journal, pen/pencil)
- material to build a V-notch weir (if applicable), such as plywood or a thin metal sheet that has been cut with a 90° notch
- pipe (if applicable)
- a small temporary dam to contain the water (a good method is described in Estimates of Water Flow [ Food and Agriculture Organization, 2024])
Different Ways to Capture All Streamflow
Adapted from “ DIY flow measurement guide ,” by Hydromatch, 2017, p. 1 (https://www.academia.edu/20372257/DIY_flow_measurement_guide).
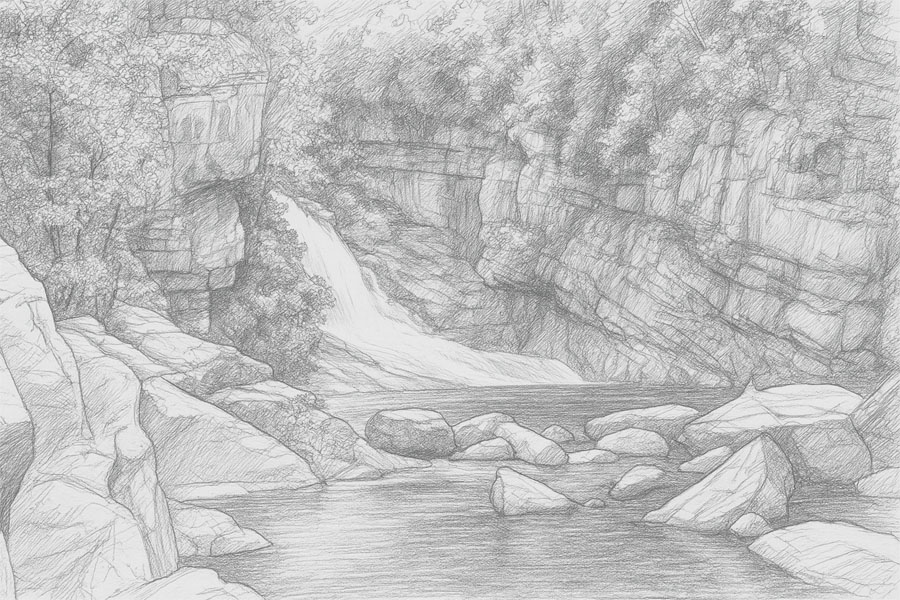
- Find a natural waterfall. This is shown in Figure 1.
- Build a V-notch weir and record the water that flows over the notch.
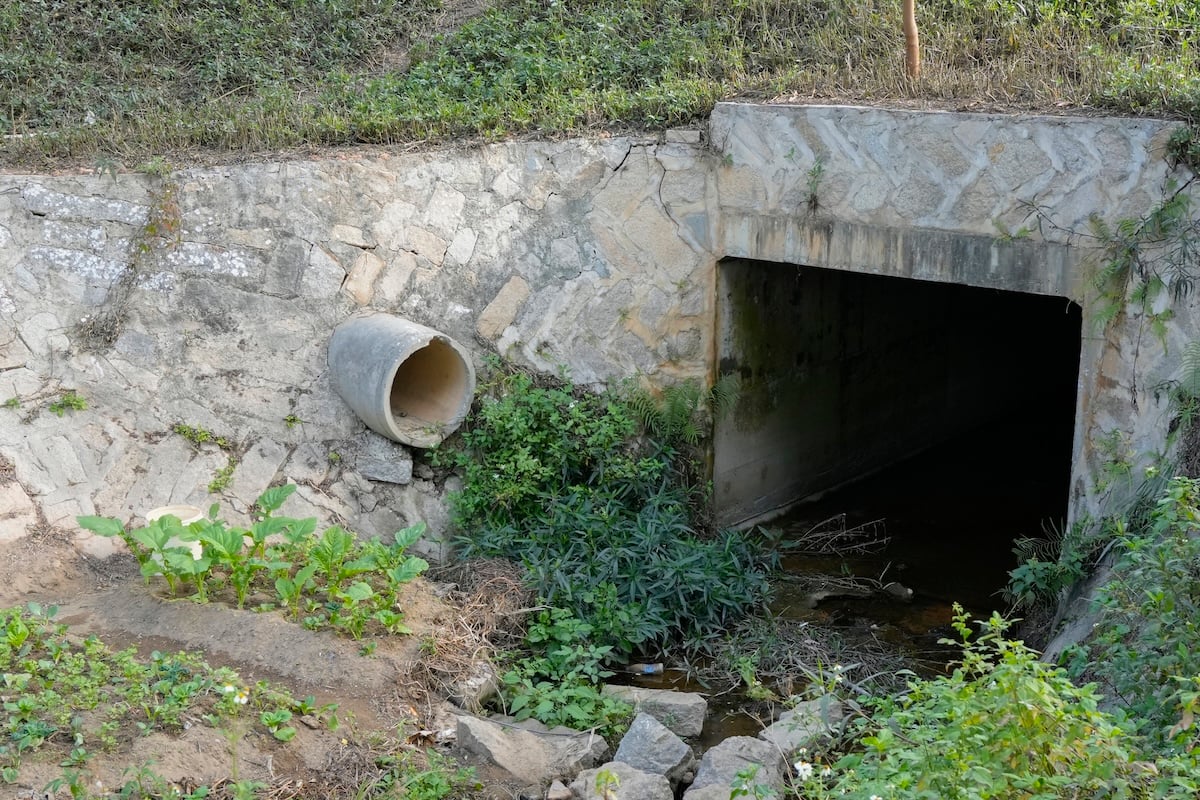
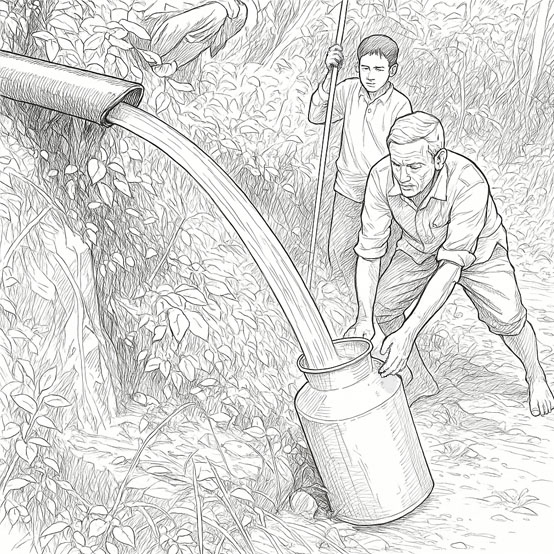
- Dam the stream and only allow flow through a pipe. This is shown in Figure 2.
Adapted from “ DIY flow measurement guide,” by Hydromatch, 2017, p.1 (https://www.academia.edu/20372257/DIY_flow_measurement_guide).
Difficulties With Using the Bucket Method
As previously stated, all the water from the stream must be directed into the container to obtain an accurate measurement. This means that unless there is a natural waterfall, a structure must be built (if only temporarily) to divert the water for measurement, which could include but is not limited to a weir or pipe (Figures 1 and 2).
Because of the simplistic nature of this method, it is only reasonable for streams and flows that are relatively small ( Food and Agriculture Organization, 2024)—5 liters per second (L/s) or 1.32 gallons per second (gps)—up to 15 L/s or about 4 gps (Hydromatch, 2017; U.S. Department of the Interior, Bureau of Reclamation, 2001). These upper limits correspond to 0.015 cubic meters per second (m3/s or cms) and 0.535 cubic feet per second (ft3/s or cfs).
Determining Streamflow Using the Bucket Method
The following five steps should be followed to measure the streamflow.
Step 1
If unknown, find the volume of the container. This can be done with a smaller container of a known volume (e.g., a 1-gallon jug or graduated cylinder). Using the smaller container, count the number of times required to fill the larger container, and multiply that figure by the volume of the smaller container.
Step 2
Locate a stream section where the stream can be directed into the large container. The ideal location is a natural waterfall or sharp drop in elevation, but if this is not available, a weir or dam with a pipe is needed to channel the flow for measurement.
A small temporary dam can be built with a pipe, which allows the water to flow through to the collection container. Many ways can be used to build a dam based on the creek or stream; a method of building a dam is described on the Food and Agriculture Organization (2024) website.
Step 3
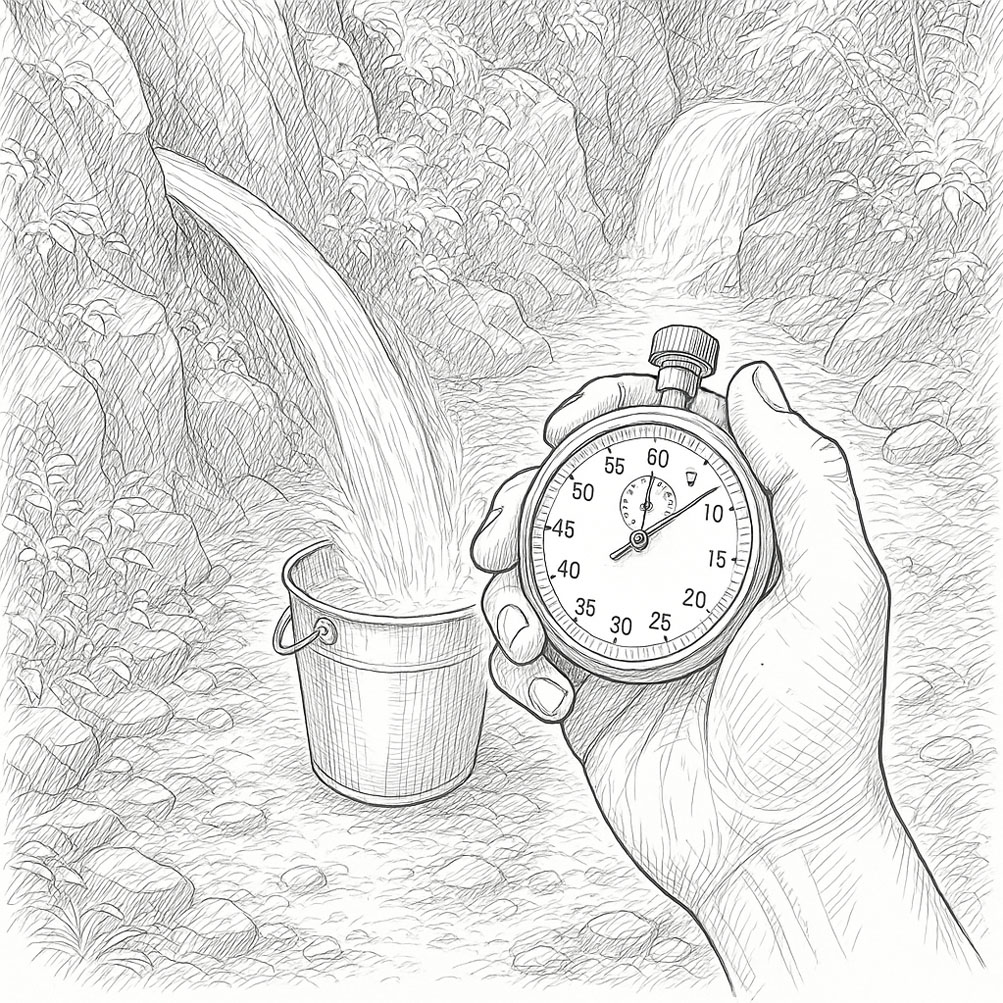
Place the empty container under the diverted flow and record the time it takes for the bucket to fill up to a known volume. A timer, such as a watch or mobile device, is helpful; however, counting seconds also is an option.
Step 4
For more accuracy, repeat Step 3 several times (at least three experiments) and record the time for each experiment to fill to the known volume. Add up the fill times and divide by the number of experiments to calculate the average time it takes to fill the container.
Step 5
Divide the known volume of the container by the average time calculated in Step 4 to obtain the streamflow. Note that final measurements should be recorded as cubic meters per second (cms) or cubic feet per second (cfs).
Simple conversions can be used to convert your calculations as needed, or you can use the conversion tables below.
Gallons per second (gps) to cubic feet per second (ft3/s cfs):
Liters per second (L/s) to cubic meters per second (m3/s or cms):
For both of these equations, substitute the volume you measured per second for 1 gallon or 1 liter in the equation to calculate your result (or use the conversion tables).
Example Using the Bucket Method
Step 1. If unknown, find the volume of the container.
In this example, we will use a 5-gallon bucket.
Step 2. Locate a stream section where the stream can be directed into the large container.
For this example, let’s assume a preexisting pipe is located along the stream that diverts the stream water, like the one in Figure 2.
Step 3. Place the empty container under the diverted flow and record the time it takes for the bucket to fill up completely.
The 5-gallon bucket took 30 s to fill up.
Step 4. For accuracy, repeat Step 3 several times and record the times for each experiment. Add the times together and divide by the number of experiments to calculate the average time it takes to fill the container up.
The first measurement was 30 s. In the three experiments following the initial measurement, the bucket filled up in 36, 33, and 29 s. Therefore, the average time it takes to fill the bucket up is:
Step 5. Divide the known volume of the container by the average time calculated in Step 4 to obtain the stream discharge.
The volume of the bucket is 5 gallons, and the average time was determined in Step 4 to be 32 s. Therefore:
Stream discharge = 5 gallons/32 s = 0.156 gallons/second
To calculate the cubic feet per second (cfs):
Conclusion
By using the bucket method and the simple calculations above, a farmer can determine the flow of a stream or channel. This step is integral in determining if they are protecting the stream by staying under the 7Q10flow (defined as the lowest 7-day average flow that occurs on average once every 10 years) or, in the Flint River basin in Georgia, under the 25% annual average discharge.
If you need help in determining streamflow or have any questions about creating a low flow protection plan, you can get help by calling the Agricultural and Natural Resources (ANR) agent at your local county Extension office.
Conversion Tables
Note: If you have a container other than the sizes listed, you can sum the flow numbers.
For example, for a 3-gallon container that took 10 seconds to fill, your final value would be found by adding the results from the 1 gallon column, 10-second row and 2-gallon column, 10 second row (see Table 1’s yellow highlighted boxes: 0.013 + 0.027 = 0.04 ft3/s). For a 3-L container that took 10 seconds to fill, your final value would be found by adding the results from the 1 L column, 10-second row and 2-L column, 10 second row (see Table 2’s highlighted boxes: 0.0001 + 0.0002 = 0.0003 m3/s). = 0.100 + 0.200 = 0.300 gallons/Liters per second (see yellow highlighted boxes)
| Flow measured in cubic feet per second (ft3/s or cfs) by the size of the container | ||||
|---|---|---|---|---|
| Time it took to fill the container (seconds) | 1-gallon container | 2-gallon container | 5-gallon container | 10-gallon container |
| 1 | 0.134 | 0.267 | 0.669 | 1.337 |
| 2 | 0.067 | 0.134 | 0.334 | 0.669 |
| 3 | 0.045 | 0.089 | 0.223 | 0.446 |
| 4 | 0.033 | 0.067 | 0.167 | 0.334 |
| 5 | 0.027 | 0.053 | 0.134 | 0.267 |
| 6 | 0.022 | 0.045 | 0.111 | 0.223 |
| 7 | 0.019 | 0.038 | 0.096 | 0.191 |
| 8 | 0.017 | 0.033 | 0.084 | 0.167 |
| 9 | 0.015 | 0.030 | 0.074 | 0.149 |
| 10 | 0.013 | 0.027 | 0.067 | 0.134 |
| 11 | 0.012 | 0.024 | 0.061 | 0.122 |
| 12 | 0.011 | 0.022 | 0.056 | 0.111 |
| 13 | 0.010 | 0.021 | 0.051 | 0.103 |
| 14 | 0.010 | 0.019 | 0.048 | 0.096 |
| 15 | 0.009 | 0.018 | 0.045 | 0.089 |
| 16 | 0.008 | 0.017 | 0.042 | 0.084 |
| 17 | 0.008 | 0.016 | 0.039 | 0.079 |
| 18 | 0.007 | 0.015 | 0.037 | 0.074 |
| 19 | 0.007 | 0.014 | 0.035 | 0.070 |
| 20 | 0.007 | 0.013 | 0.033 | 0.067 |
| 21 | 0.006 | 0.013 | 0.032 | 0.064 |
| 22 | 0.006 | 0.012 | 0.030 | 0.061 |
| 23 | 0.006 | 0.012 | 0.029 | 0.058 |
| 24 | 0.006 | 0.011 | 0.028 | 0.056 |
| 25 | 0.005 | 0.011 | 0.027 | 0.053 |
| 26 | 0.005 | 0.010 | 0.026 | 0.051 |
| 27 | 0.005 | 0.010 | 0.025 | 0.050 |
| 28 | 0.005 | 0.010 | 0.024 | 0.048 |
| 29 | 0.005 | 0.009 | 0.023 | 0.046 |
| 30 | 0.004 | 0.009 | 0.022 | 0.045 |
| Flow measured in cubic meters per second (m3/s or cms) by the size of the container | ||||
|---|---|---|---|---|
| Time it took to fill the container (seconds) | 1 L container | 2 L container | 5 L container | 10 L container |
| 1 | 0.00100 | 0.00200 | 0.00500 | 0.01000 |
| 2 | 0.00050 | 0.00100 | 0.00250 | 0.00500 |
| 3 | 0.00033 | 0.00067 | 0.00167 | 0.00333 |
| 4 | 0.00025 | 0.00050 | 0.00125 | 0.00250 |
| 5 | 0.00020 | 0.00040 | 0.00100 | 0.00200 |
| 6 | 0.00017 | 0.00033 | 0.00083 | 0.00167 |
| 7 | 0.00014 | 0.00029 | 0.00071 | 0.00143 |
| 8 | 0.00013 | 0.00025 | 0.00063 | 0.00125 |
| 9 | 0.00011 | 0.00022 | 0.00056 | 0.00111 |
| 10 | 0.00010 | 0.00020 | 0.00050 | 0.00100 |
| 11 | 0.00009 | 0.00018 | 0.00045 | 0.00091 |
| 12 | 0.00008 | 0.00017 | 0.00042 | 0.00083 |
| 13 | 0.00008 | 0.00015 | 0.00038 | 0.00077 |
| 14 | 0.00007 | 0.00014 | 0.00036 | 0.00071 |
| 15 | 0.00007 | 0.00013 | 0.00033 | 0.00067 |
| 16 | 0.00006 | 0.00013 | 0.00031 | 0.00063 |
| 17 | 0.00006 | 0.00012 | 0.00029 | 0.00059 |
| 18 | 0.00006 | 0.00011 | 0.00028 | 0.00056 |
| 19 | 0.00005 | 0.00011 | 0.00026 | 0.00053 |
| 20 | 0.00005 | 0.00010 | 0.00025 | 0.00050 |
| 21 | 0.00005 | 0.00010 | 0.00024 | 0.00048 |
| 22 | 0.00005 | 0.00009 | 0.00023 | 0.00045 |
| 23 | 0.00004 | 0.00009 | 0.00022 | 0.00043 |
| 24 | 0.00004 | 0.00008 | 0.00021 | 0.00042 |
| 25 | 0.00004 | 0.00008 | 0.00020 | 0.00040 |
| 26 | 0.00004 | 0.00008 | 0.00019 | 0.00038 |
| 27 | 0.00004 | 0.00007 | 0.00019 | 0.00037 |
| 28 | 0.00004 | 0.00007 | 0.00018 | 0.00036 |
| 29 | 0.00003 | 0.00007 | 0.00017 | 0.00034 |
| 30 | 0.00003 | 0.00007 | 0.00017 | 0.00033 |
References
Food and Agriculture Organization. (2024). 3.2 Bucket Method. In Estimates of Water Flow. Retrieved October 9, 2024, from https://www.fao.org/fishery/docs/CDrom/FAO_Training/FAO_Training/General/x6705e/.%2133600%21x6705e03.htm
Graf, W. L. (2006). Downstream hydrologic and geomorphic effects of large dams on American rivers. Geomorphology, 79(3–4), 336–360. https://doi.org/10.1016/j.geomorph.2006.06.022
Hydromatch. (2017). DIY flow measurement guide. https://www.academia.edu/20372257/DIY_flow_measurement_guide
Mdee, O. J., Kimambo, C. Z., Nielsen, T. K., & Kihedu, J. (2018). Measurement methods for hydropower resources: A review. Water Utility Journal, 18, 21–38. https://www.ewra.net/wuj/pdf/WUJ_2018_18_03.pdf
Ligon, F. K., Dietrich, W. E., & Trush, W. J. (1995). Downstream ecological effects of dams: A geomorphic perspective. BioScience, 45(3), 183–192. https://doi.org/10.2307/1312557
Magilligan, F. J., & Nislow, K. H. (2005). Changes in hydrologic regime by dams. Geomorphology, 71(1–2), 61–78. https://doi.org/10.1016/j.geomorph.2004.08.017
Othman, A., Khairudin, W., Othman, J., Ghani, M. A., & Saudi, A. S. M. (2017). Water flow measuring methods in small hydropower for streams and rivers: A study. International Journal of Applied Engineering Research, 12(24), 14484–14489. https://www.researchgate.net/publication/322631290_Water_flow_measuring_methods_in_small_hydropower_for_streams_and_rivers-A_study
Poff, N. L., & Hart, D. D. (2002). How dams vary and why it matters for the emerging science of dam removal. BioScience, 52(8), 659–668. https://doi.org/10.1641/0006-3568(2002)052[0659:HDVAWI]2.0.CO;2
U.S. Department of the Interior, Bureau of Reclamation. (2001). Water measurement manual (3rd ed., revised reprint). U.S. Government Printing Office. https://www.usbr.gov/tsc/techreferences/mands/wmm/WMM_3rd_2001.pdf
Ward, A. D., & Trimble, S. W. (2003). Environmental hydrology (2nd ed.). CRC Press. https://doi.org/10.1201/b13148