
Additional authors include Kaylyn R. Reagin, Ph.D., former UGA Cotton and Peanut Sustainability Extension Educator; and Lori A. Duncan, Row Crop Sustainability Specialist, University of Tennessee.
What Is Sustainability, and How Do We Measure It?
Sustainability is an important concern across the agricultural supply chain. Consumers are searching for information on the sustainability of practices used to produce their food and fiber products from the field to store shelves. But what does it mean to be “sustainable”? There are various definitions of sustainability, but there are three general themes present in almost all definitions: economics, society, and environment.
Brands and retailers, alongside consumers, are increasing their demand for transparency on agriculture’s environmental footprint. With the rise of climate change concerns, which include crop water requirements and greenhouse gas emissions, reporting the impact of row crop production on the environment is imperative. But how can we measure on-farm sustainability?
There are several free online resources available to producers. These include the USDA COMET-Farm and COMET-Planner tools, Cool Farm Tool, and others. An additional resource, used in UGA research projects, which is also available to farmers and trusted advisers to measure their environmental footprint is the Field to Market Fieldprint Platform®.
Field to Market’s Fieldprint Platform
Field to Market®: The Alliance for Sustainable Agriculture is a nonprofit organization that drives engagement between various agribusinesses, grower organizations, brand and retail companies, environmental advocacy organizations, and research institutions to develop environmental standards and metrics among various commodity crops (Konefal et al., 2019).
In 2009, Field to Market began evaluating corn, cotton, soybean, and wheat trends in public data from 1987–2007 in soil loss, greenhouse gas emissions, energy use, irrigation water use, and land use metrics. Using this data, Field to Market developed and launched the Fieldprint® Calculator in 2009 within the Fieldprint Platform to allow growers to measure these environmental outcomes (also known as metrics) for each of their crops (Field to Market, 2023).
To date, Field to Market has updated the Fieldprint Calculator to include additional metrics, as well as state and national benchmarks. These benchmarks allow growers to compare the scores from their farms to state and national averages. The sustainability metrics evaluated include land use, energy use, greenhouse gas emissions, soil conservation, irrigation water use, water quality, soil carbon, and biodiversity.
Fieldprint Platform Overview
To receive scores for the sustainability metrics, farmers, consultants, or other trusted advisers can create a free account on the Field to Market website. Once an account is made, users can establish a farm name under which required information for each field of interest can be entered.
A field boundary can be imported using a shapefile exported from a grower’s farm management software platform, or the field can be mapped out in the calculator with an interactive map. After the field has been entered, the grower or trusted adviser can begin entering crop years. Various inputs and management practices are required when entering information for the field of interest. These inputs can be found in Appendix A.
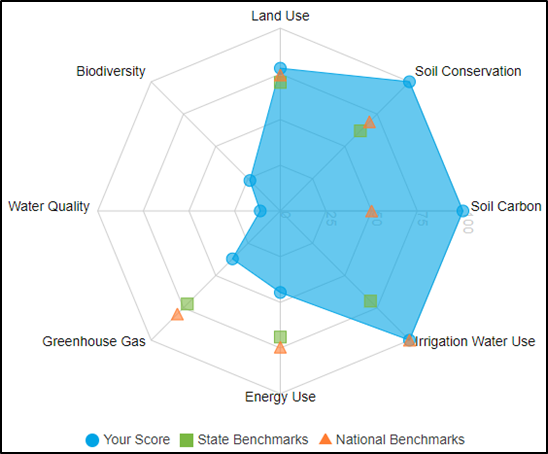
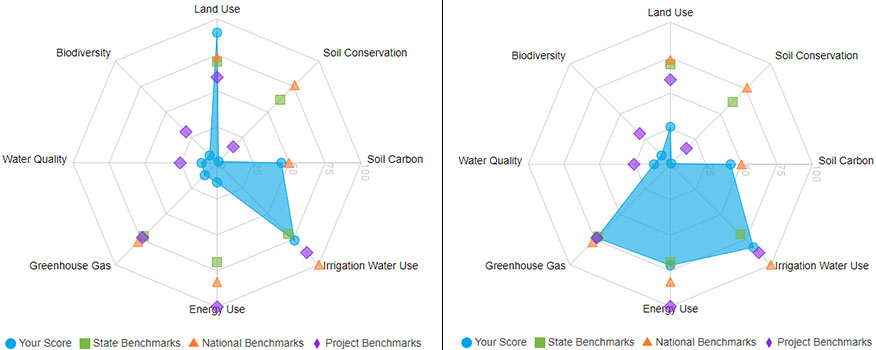
Once inputs are entered, field-level scores for the eight sustainability metrics are presented numerically and visually in a spidergram graph (Figure 1). Note that benchmarks are crop-specific. You cannot compare two or more crops on one spidergram, just the same crop over time. However, you can compare crop data to crop data. The scores for the field are presented with blue circles, and more desirable scores will be closer to the center of the graph.
For comparison, state and national benchmarks for land use, soil conservation, irrigation water use, energy use, and greenhouse gas emissions are also presented on the graph (see green square and orange triangle markers on Figure 1). Benchmarks were developed from 5-year performance averages based on data from the U.S. Department of Agriculture (USDA) or other publicly available data. Additionally, the Fieldprint Calculator provides management-practice recommendations, which can help influence and improve the sustainability metrics for the field entered.
Sustainability Metrics
Metrics are quantifiable outcomes that were calculated using equations or algorithms within the Fieldprint Platform that will be described in more detail below.
Land Use
The land use metric is a measure of efficiency, determining how much land it takes to produce a crop. The crop yield and field acreage are used, resulting in a score that represents units of planted land area per unit of crop (e.g., bushels, pounds, etc.). For the land use metric, lower scores are desirable. Results are used to provide improvement recommendations that would result in lower scores and higher sustainability.
Energy Use
The energy-use metric measures energy expended from preplant through the first point of sale in one crop year, including crop inputs. Various management practices that are inputted in the Fieldprint Calculator impact the energy-use metric, including field operations (e.g., tillage practices, planting, application of crop protectants, etc.), irrigation energy, drying/storage, and transportation. Scores are presented in British Thermal Units (BTUs) on a per-pound or per-acre basis. There are seven subcomponents to the energy-use metric, as described in Table 1.
|
Subcomponent |
Description |
|---|---|
|
Management energy |
Energy from field operations (tillage, planting, harvesting, trips across field, etc.) |
|
Application energy |
Fertilizer/crop protectant application; energy required to manufacture products applied |
|
Manure loading energy |
Loading and spreading manure (liquid, slurry, semi-solid, or solid) |
|
Seed energy |
Energy required to produce the seed |
|
Irrigation energy |
Energy required to run irrigation pumps |
|
Postharvest treatment energy |
Postharvest energy; crop drying & storage |
|
Transportation energy |
Energy used for hauling the crop from the field to first point of sale |
Greenhouse Gas Emissions
The greenhouse gas emissions metric measures the total emissions from energy use, nitrous oxide (N2O) from the soil, and residue burning. This metric is measured in pounds of carbon dioxide equivalent (CO2e) per unit of crop production. CO2e standardizes all greenhouse gases based on their global warming potential; for example, N2O is 298 CO2e, or 298 times the global warming potential of 1 CO2 molecule. The subcomponents considered within the greenhouse gas emissions metric are shown in Table 2.
|
Subcomponent |
Description |
|---|---|
|
Emissions from energy use |
Emissions from the energy use metric (BTU/unit of crop production) |
|
Emissions from soils |
N2O – result from soil biological processes, climate, soil properties From organic matter, nitrogen (N) amendments, application timing |
|
Emissions from residue burning |
Measures N2O and methane from residue burning prior to planting a cash crop |
Soil Conservation
The soil conservation metric considers the amount of soil lost to wind and water erosion throughout the crop year. This metric is reported as tons of soil lost per acre and is calculated using models from the USDA Natural Resources Conservation Service (NRCS). These models pull site-characteristic data from the USDA Web Soil Survey and utilize crop management practices input by the user to calculate the final soil-loss metric.
Irrigation Water Use
The irrigation water use metric measures the amount of water used to increase crop yield and is presented as the amount of water applied per unit of crop yield (i.e., acre-inches/pound). This metric evaluates irrigated yield versus rainfed yield to represent the production of the crop in the same field but under rainfed conditions. If a crop would not be grown on the field of interest in rainfed conditions, the rainfed yield should be entered as “0” in the Fieldprint Calculator. Additionally, irrigation events occurring before planting the cash crop should also be entered in the estimated irrigation amount.
Soil Carbon
Soil carbon is crucial for maintaining and improving soil physiological properties (i.e., water infiltration, nutrient and water holding capacity, carbon storage). This metric uses the USDA NRCS Soil Conditioning Index (SCI). There are three major components impacting soil carbon: organic matter and incorporating crop residue back into the soil; water and wind erosion; and the degree of soil disturbance caused by the field operations utilized (i.e., tillage). SCI is ranked on a scale from -1 to 1, where negative scores represent a loss of soil carbon, neutral scores (-0.05 to 0.05) represent maintenance, and positive scores indicate there is an increase of soil carbon.
Biodiversity
The biodiversity metric measures a farm’s ability to support a diverse community of plants and animals, which are influenced by farm management practices. The Habitat Potential Index (HPI) was developed by Field to Market and considers field-level components entered into a farm’s profile instead of just one crop field. The field-level components include tillage type, crop rotation type, the use of cover crops, nutrient management, pest management, water conservation, drainage water management, and wildlife habitat enhancements on cultivated land.
Metric Considerations
There are a few considerations when evaluating scores for these eight sustainability metrics, especially when management practices have not changed from year to year, but one or more metrics have declined.
First, weather events may cause an unavoidable change in the metrics. For example, Hurricane Michael devastated a large amount of crop acreage in 2018. In that year, land-use metric scores declined. However, 2019 scores improved as there were no catastrophic weather events.
In the Fieldprint Platform, growers can visualize how each metric changes following weather events, changes in management, or other factors by viewing their spidergram graphs for multiple years (Figure 2).
Another consideration when evaluating changes in sustainability metric scores is the crop rotation used. In the Southeast, it is not uncommon to rotate between a leguminous crop (i.e., peanuts) with cotton or corn in a multiyear rotation. Peanuts, like most leguminous crops, can fix atmospheric nitrogen (N2) with the production of root nodules. These nodules contain bacteria that fix N2, converting it to more plant-available forms and potentially contributing between 90 and 170 lb N/ac in a peanut crop (Boddey et al., 1990). With this plant-available nitrogen (N), there is the potential to improve sustainability metrics from one crop year to the next if synthetic nitrogen rates decrease, especially when compared to a continuous nonleguminous crop rotation.
An Example of Using the Fieldprint Platform in Georgia
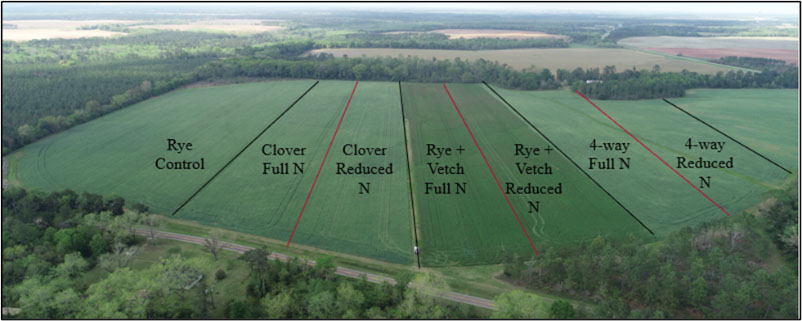
From 2020 to 2022, an on-farm cover crop trial was established in Terrell County, GA. This trial was conducted to evaluate the impact that various cover-crop treatments had on nitrogen application and on-farm sustainability of a cotton crop. A 70-acre field in a 1-year corn, 2-year cotton rotation was selected for this research trial. Corn was planted in 2020 and, following the harvest, four 17-acre strips were planted into different cover-crop treatments. In 2021 and 2022, cotton was planted as the cash crop.
The four cover-crop treatments were ‘Elbon’ cereal rye monoculture; ‘Dixie’ crimson clover monoculture; a mixture of ‘Wrens Abruzzi’ cereal rye and ‘AU Merit’ hairy vetch; and a multiple-species mixture that varied by year. The multiple-species mixture planted during the first cover-crop planting following the corn harvest consisted of ‘Wrens Abruzzi’ cereal rye, ‘Cosaque’ black-seeded oats, ‘AU Merit’ hairy vetch, and ‘Dixie’ crimson clover.
In the second cover-crop planting following the first cotton harvest, the multiple-species treatment consisted of ‘Wrens Abruzzi’ cereal rye, winter triticale, ‘Villana’ hairy vetch, and ‘Dixie’ crimson clover. For this study, the ‘Elbon’ cereal rye treatment was considered the control, as it is one of the most common cover crops planted in the region (McAllister, S., personal communication, August 20, 2020).
Prior to cover-crop termination, biomass samples were collected to conduct a quality analysis. The data received from the analysis was entered into the UGA Cover Crop Nitrogen Availability Calculator (https://aesl.ces.uga.edu/mineralization/) to determine how much N would be mineralized throughout the cotton growing season.
For this research, each cover-crop treatment was split into two subplots, except for the rye monoculture treatment. One half of the treatment received a full rate of N (28-0-0-5) while the other half received a reduced rate of N, which was suggested by the UGA Cover Crop Nitrogen Availability Calculator (Figure 3). Table 3 shows the nitrogen rates for 2021 and 2022.
|
Treatment |
Application rate (lb/ac) per year |
|
|---|---|---|
|
2021 |
2022 |
|
|
Cereal rye |
110 |
90 |
|
Crimson clover full rate |
110 |
90 |
|
Crimson clover reduced rate |
50 |
50 |
|
Rye + vetch full rate |
110 |
90 |
|
Rye + vetch reduced rate |
65 |
40 |
|
4-way mix full rate |
110 |
90 |
|
4-way mix reduced rate |
56 |
40 |
At the end of each cotton growing season, field operations from that year were recorded. These operations included the number of trips taken across the field with equipment for seedbed preparation, nutrient management, and crop protectants; irrigation amounts; and final crop yields. All of this information was then entered into the Field to Market Fieldprint Calculator to receive sustainability metrics scores.
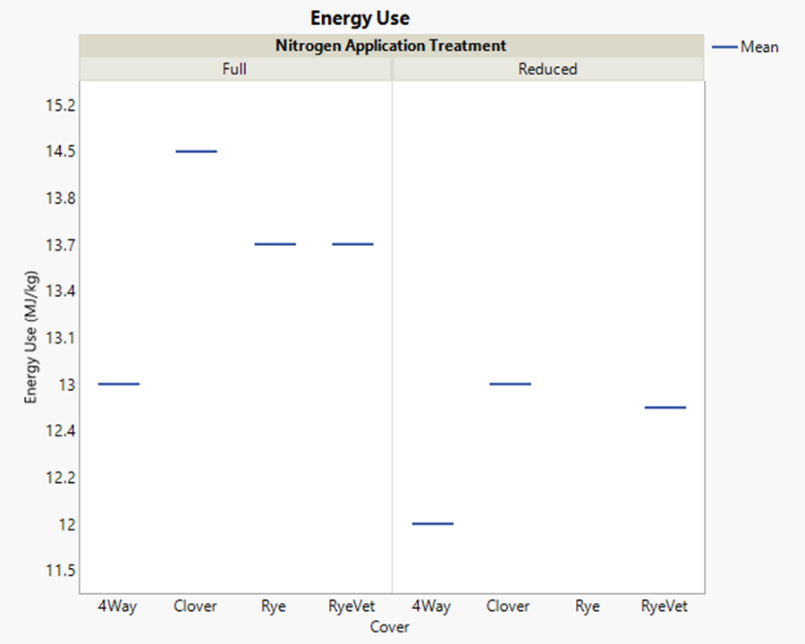
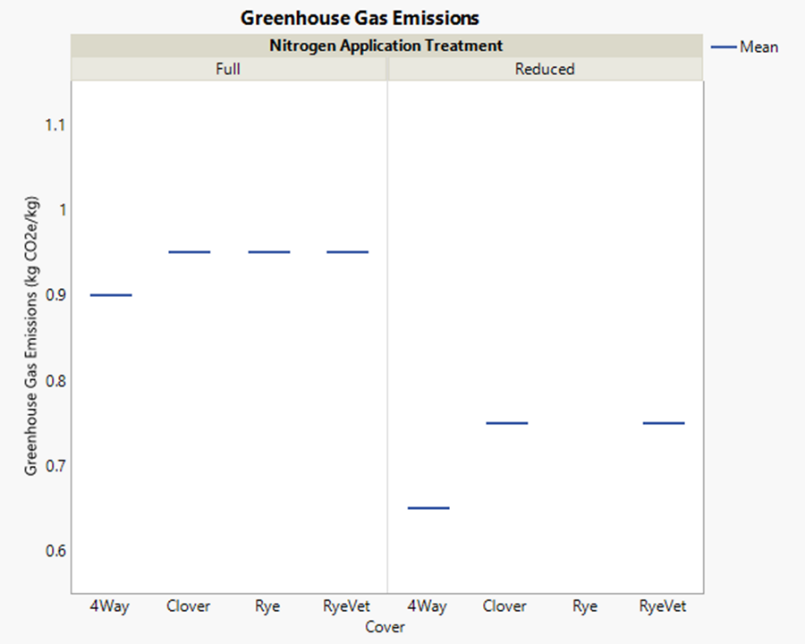
From the Fieldprint Calculator results, energy use and greenhouse gas emissions were impacted by this on-farm trial (Figures 4 and 5). Figure 4 shows the mean energy-use scores across both years of the study. When applying a reduced rate of N, energy use was reduced with each treatment, apart from the cereal rye monoculture (as there was no N reduction treatment). Similar trends were seen in the mean greenhouse-gas-emission scores (Figure 5).
When looking to conduct an on-farm study, compare sustainability metrics for multiple fields, or just understand your farm’s current environmental footprint, the Fieldprint Platform can provide you with substantial information and resources.
Supply Chain Sustainability Programs
The demand for transparency from brands and retailers is on the rise; as these buyers, domestically and internationally, seek to market food products to consumers, it is crucial to showcase the production of high-quality U.S. food and fiber products. Various commodity crops are creating traceability programs using the Fieldprint Platform to meet these needs.
U.S. Cotton Trust Protocol
Established in 2020, the U.S. Cotton Trust Protocol is the first voluntary program to use verified data to provide supply chain transparency. Utilizing the Fieldprint Platform, growers enter field-level information to receive quantifiable scores for six sustainability metrics. A self-assessment and other available tools help growers identify areas of improvement in their operations. There are various benefits for enrollment in the Trust Protocol, including access to verified data, insights on best management practices, and article-level transparency throughout the supply chain. Visit their website to learn more about the U.S. Cotton Trust Protocol (www.trustuscotton.org).
Sustainable U.S. Peanut Initiative
In 2021, the American Peanut Council launched the Sustainable U.S. Peanut Initiative using the Fieldprint Platform’s sustainability metrics. Like the U.S. Cotton Trust Protocol, the Peanut Initiative is seeking to verify that peanuts are grown using the best agricultural practices, provide sustainability metrics, and communicate the practices and metrics within the supply chain. These crop-specific programs have similar benefits, and growers can access both programs on the same server to minimize the amount of information they need to enter. Visit the Sustainable U.S. Peanut Initiative website to learn more (www.sustainableuspeanuts.org).
Data Usage and Privacy
Field to Market and programs like the U.S. Cotton Trust Protocol and the Sustainable U.S. Peanut Initiative have privacy policies in place to protect grower information. When using these programs, a grower’s personal information (i.e., name, email, phone number) and farm data (e.g., field location, farm operations, etc.) are collected to generate Fieldprint results and reports. These reports include options for growers to improve the sustainability metrics for their fields and promote the adoption of sustainable management practices. If information is to be shared with any third party, prior consent is required from the grower.
Conclusion
Agricultural sustainability is at the forefront of food and fiber supply chains. An increased demand for transparency from brands, retailers, and consumers has led to the push to measure on-farm sustainability. Field to Market: The Alliance for Sustainable Agriculture and its Fieldprint Platform provide a free tool for growers and their trusted advisers to meet this demand.
By measuring eight sustainability metrics over time, growers can make improved management decisions to increase their on-farm sustainability. Programs such as the U.S. Cotton Trust Protocol and the Sustainable U.S. Peanut Initiative, which use the Fieldprint Platform, are available to establish another layer of transparency and marketability for U.S. food and fiber production.
|
Required input |
Details/options |
|---|---|
|
Field location |
Can be imported as a shapefile (.shp) or located on a map within the platform |
|
Crop rotation type* |
Crop to fallow, crop rotation, or continuous crop |
|
Tillage* |
Conventional/intensive, reduced, or no-till/strip till/conservation tillage |
|
Crop rotation library* (provides an in-depth look on the crop rotation for the field of interest) |
The rotation can be a premade rotation created by NRCS Conservation Resources Land Management and Operations Database (LMOD) or one can be created from scratch. The information needed includes equipment taken over the field, irrigation events, trips for crop protectant or fertilizer application, planting/harvest dates, cover crop planting/termination, etc. |
|
Wind barrier |
Yes/No |
|
Tile drainage |
None, standard density, standard density with water management, high density, high density with water management |
|
Lime application |
Year lime was applied, number of years between lime application, amount applied (ton/acre) |
|
Nitrogen and phosphorus |
Nutrient management techniques |
|
Pest management |
Implementation of IPM: Without chemical control, with chemical control, additional site-specific techniques |
|
Water conservation |
One or more water conservation practices for the field of interest (e.g., field border, grassed waterway, irrigation water management, etc.) |
|
Planting |
Seeding rate, seed treatment (yes/no) |
|
Irrigation |
Irrigation method, water source, water applied (inch/acre; preplant through growing season), energy (pumping pressure, pumping depth, energy source) |
|
Crop protectant and fertilizer operations |
Number of herbicides, insecticides, fungicides, growth regulators, and/or fumigants applied each trip over the field. The rate and analysis of fertilizer applied are needed. |
|
*This information is needed for both the Fieldprint questionnaire and the Crop Rotation Library within the platform. |
|
References
Boddey, R. M., Urquiaga, S., Neves, M. C. P., Suhet, A. R., & Peres, J. R. (1990). Quantification of the contribution of N2 fixation to field-grown grain legumes—A strategy for the practical application of the 15N isotope-dilution technique. Soil Biology and Biochemistry, 22(5), 649–655. https://doi.org/10.1016/0038-0717(90)90011-N
Field to Market. (n.d.). Uniting the supply chain to deliver sustainable outcomes for agriculture. Retrieved April 24, 2023, from https://fieldtomarket.org/
Konefal, J., Hatanaka, M., & Constance, D. H. (2019). Multi-stakeholder initiatives and the divergent construction and implementation of sustainable agriculture in the USA. Renewable Agriculture and Food Systems, 34(4), 293–303. https://doi.org/10.1017/S1742170517000461