

Introduction
Vegetables are the second-most-valuable agricultural crop sector in Georgia, with an estimated farm-gate value of over $1.2 billion, with more than two dozen vegetable crops produced on a commercial scale. Because of the climate in Georgia (i.e., high temperatures and humidity), a wide variety of diseases occur in vegetable production, particularly in the warmer months, causing significant yield reductions if not effectively managed. As an example, Phytophthora blight (caused by Phytophthora capsici) can cause up to 80% yield loss in peppers in severe cases (B. Dutta, personal communication). Management of diseases is necessary to protect crops against disease pathogens and reduce their spread in vegetable fields.
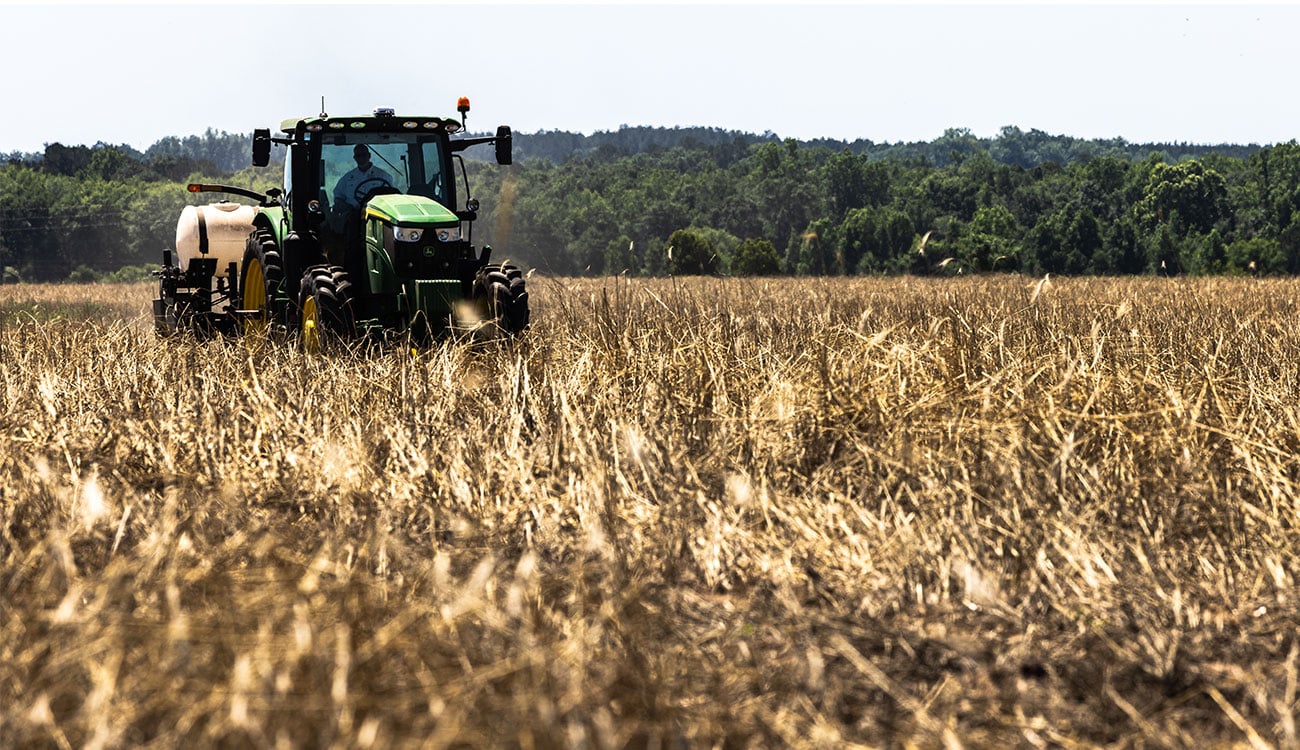
This study aims to detect Phytophthora blight severity, a major disease affecting pepper plants, using drone technologies. This 3-year study began with the collection of drone images in the first year. We utilized two cameras, one RGB and another multispectral, to capture visible and spectral imagery to extract meaningful features and vegetation indices, enabling the detection of Phytophthora blight in pepper plants.
Material and Methods
In the first year, we collected drone imagery from a grower’s pepper field in Whigham, GA (Grady County). This location was chosen because Phytophthora blight first appeared in the southwestern part of the state in 2024. Although the field was large, the disease incidence was initially observed in just one corner. We generated a flight-planning map for this area, showing the Phytophthora blight symptoms, and conducted drone flights accordingly. The area covered for drone imagery collection was about 0.45 hectares (where disease incidence was first observed).
We collected images three times during the pepper growing season using the DJI M350 RTK drone equipped with H20 color and RedEdge-P multispectral cameras. Images were captured at three critical times: the early stage of disease symptoms, the moderate stage of disease incidence, and the severe stage of disease incidence. Capturing images at these three stages allowed us to detect and monitor the disease progression and spread across the field.
The captured images were stitched together to generate an orthomosaic image showing the field area under experimentation (Figure 1). Pix4D software was used for image stitching.

Additionally, we generated five different vegetation indices: Normalized Difference Vegetation Index (NDVI), Green Normalized Difference Vegetation Index (GNDVI), Excessive Green Index, Red Normalized Difference Vegetation Index (RNDVI), and Soil Adjusted Vegetation Index (SAVI). These indices were instrumental in identifying spectral differences indicative of Phytophthora blight symptoms, offering unique insights into the health and vigor of the pepper plants.
Analyses were conducted to determine which vegetation indices are most effective for detecting Phytophthora blight in pepper crops. These indices were evaluated for their ability to highlight disease symptoms through remote-sensing techniques, enabling early and accurate identification of infected plants.
Results
Our spectral analysis results show a correlation between the NDVI vegetation index and Phytophthora blight disease incidence (Figure 2). This correlation arises because infected pepper plants wilt and develop dark brown lesions, whereas healthy plant leaves remain green and firm. Since NDVI measures the greenness of plants, it proved to be a highly significant index for this study.
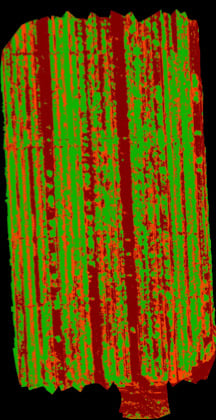
Our findings from the first year indicate that areas with lower NDVI and GNDVI values correspond to regions where initial wilting and dark lesions on stems were observed. We have currently generated five indices, but we plan to generate more than 10 indices to conduct a more comprehensive analysis. As the disease progresses to the moderate stage, the RNDVI and SAVI indices may become more relevant. These indices, which account for soil-background effects and red-edge reflectance, could provide a clearer picture of disease spread and severity. The RNDVI is particularly sensitive to changes in chlorophyll content, making it a valuable tool for monitoring disease progression.
There may be other indices that show more distinct differences between plants infected with Phytophthora blight and healthy plants. Continuing this study will be essential for comprehensively analyzing the visible and multispectral imagery to develop a reliable scouting system.
Conclusion
The use of multispectral cameras combined with vegetation indices has demonstrated strong potential for monitoring Phytophthora blight in pepper fields, offering valuable preliminary insights into disease dynamics. Continued research is essential to gather additional data and develop a reliable, robust system for accurate disease scouting. Furthermore, integrating drone-based imagery with vegetation indices represents a major advancement in precision agriculture, providing a scalable and efficient approach for disease detection and overall crop health monitoring.