

Workbooks and Tutorials
- Experimental Power Graphing Program (EPGP; Microsoft Excel file)
- EPGP PowerPoint Tutorial (Microsoft PowerPoint file)
- Quantile Plotting Distribution Optimization Library (QPDOL; Microsoft Excel file)
- QPDOL PowerPoint Tutorial (Microsoft PowerPoint file)
- Inverse Transformation Scale Experimental Power Graphing (ITSEPG; Microsoft Excel file)
- ITSEPG PowerPoint Tutorial (Microsoft PowerPoint file)
- Experiment Simulating Program (ESP; Microsoft Excel file)
- ESP PowerPoint Tutorial (Microsoft PowerPoint file)
Experimental power determinations are very important to agriculture and other applied sciences. It is necessary to be able to detect small differences when human and animal health or production profitability are in question. Yet textbooks on biostatistics for agriculturalists generally barely introduce the subject of how to design an experiment to detect some important difference between treatments.
For example, a recent biostatistics text has about one page on experimental design and the number of necessary replications but about 540 pages on how to analyze and interpret experiments that have already been conducted.
To come to meaningful conclusions, researchers need to know how to plan both plan and conduct experiments. Entirely different questions may be asked of an experiment depending on who is to interpret the results. Developers may be most interested in showing that their new product gives responses not statistically significantly different from some standard. Potential consumers, on the other hand, should be more interested in demonstrating that expected responses from a new product are equal to the standard (Neyman, 1977).
In other words, to show a product is adequate (not significantly different from the standard), design an experiment with little power (low number of replicates).
And to show a product equivalent, design an experiment with a high degree of power (high number of replicates). Intuitively, agricultural scientists often conclude that “not significantly different from” is the equivalent of “equal to,” but that is not necessarily true. The number of replicates used in agricultural experiments is often based more on tradition than hard deliberation. Our intuition is likely to lead to a large number of false negatives (Greenland, 2011). Experiments that do not result in significant differences do not really prove that no significant differences exist. Some indication of the size of differences that might be detected by an experiment would be helpful to properly interpret that “no significant differences were found.”
Once an experiment is completed, the reader should be given the precise probability that differences were due to chance (p-value) and the confidence intervals. Knowing the experimental power is not particularly helpful once the experiment has been completed. The expected power after the experiment is completed may actually be misleading since it has no bearing on the p-value of the hypothesis that was tested. Experimental power is useful as a planning tool but should not be confused with an analytical tool (Greenland, 2012).
Greenland et al. (2016) have explained various problems commonly encountered with determining and interpreting experimental power. One major problem in designing experiments is that experimental power isn’t often formally considered. The number of treatments and replicates per treatment are often decided upon informally based on convenience and budgets more than any determination of how likely an experiment is to detect meaningful differences.
With experiments for agricultural production, economics should always be a primary concern. The shape of the experimental power curves demonstrates the nature of the important considerations for agriculturists. Because of the sigmoidal (“S”-shaped) nature of the curves, adding more replicates has large effects on experimental power at first. But eventually, the curves show diminishing returns phenomena and adding more replicates per treatment is without large consequence. The agricultural experimentalist has to decide when the cost of more replicates justifies the resultant (diminishing) return in increased experimental power. For experiments on human health, it is more difficult to establish parameters for a cost and returns analysis.
Experimental power has not been particularly easy to determine, at least until now. There are some very good web pages and texts that explain the theory behind experimental power and help with the calculations, some of which are listed at the end of this document. Researchers have typically calculated experimental power as a single probability. Typical statements are that an experiment with eight replicates per treatment and 5% coefficient of variation may have a 90% chance of detecting a 5% difference in means, with a cutoff for “significance” of α = 0.05 (confidence level or p = 0.05).
The same experiment might have a 100% chance of detecting a 10% difference in means, but only a 20% chance of detecting a 3% difference in means. So the typical expression of experimental power is much like a photograph when a motion picture is needed to properly interpret and apply the concept under study.
To address this problem, we developed a Microsoft Excel workbook to graph power curves for potential differences in two means with different numbers of replicates per treatment. All the user has to enter is 1., the expected control mean, 2., the expected standard deviation, and 3., the confidence level, which results in the following output:
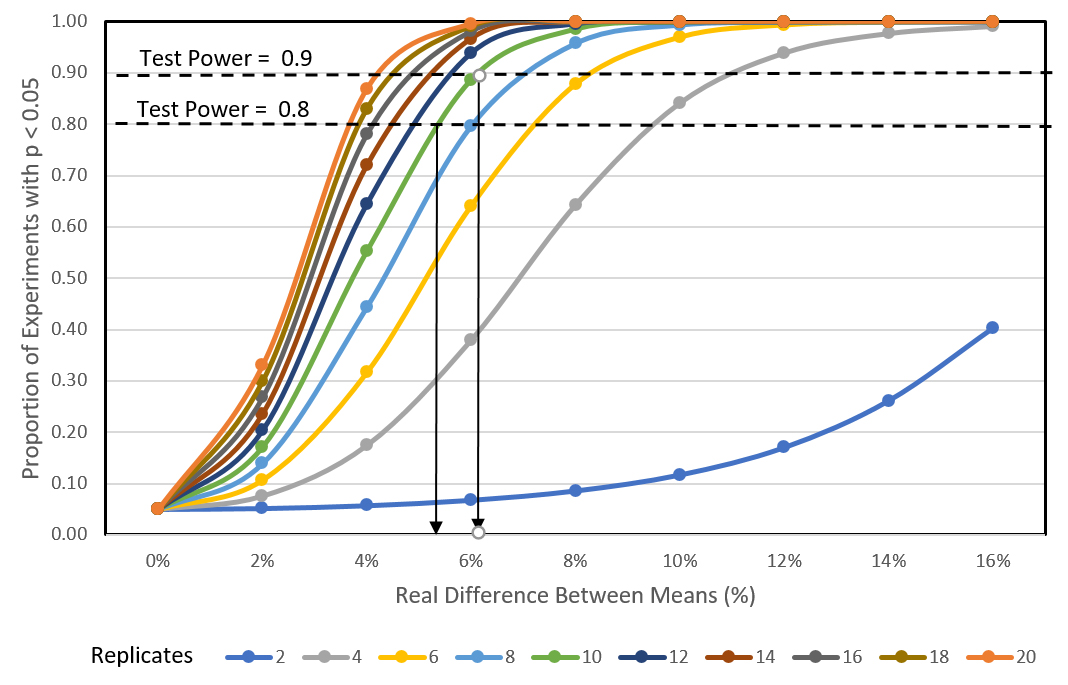
An EPGP.xls generated graph shows a more complete projection of what can be expected from a future experiment. In this example, the control mean is expected to be 1.0 with a standard deviation of 0.04 for the control and treatment means:
- Even if there is no difference in means, 5% of the time the null hypothesis that there is no difference will be rejected.
- If duplicate pens per treatment are used, even a 16% difference in means will be declared significant only about 40% of the time.
- Even with 20 replicates per treatment, a 2% difference will be declared significant only 30% of the time.
- Doubling the size of the experiment from 10 to 20 reps per treatment will increase the odds of declaring a 5% difference in means from 70% to 95%.
- Doubling the size of the experiment from 10 to 20 reps per treatment will decrease the difference in means detected 80% of the time from 5.3% to 3.7%.
EPGP.xls helps planners to see the ramifications of using different numbers of replicates per treatment. Another aspect that can be explored is the influence of variation on experimental power. Things like using only one gender in an experiment or increasing the number of subjects in a pen (experimental unit) to decrease experimental variation may be explored and considered.
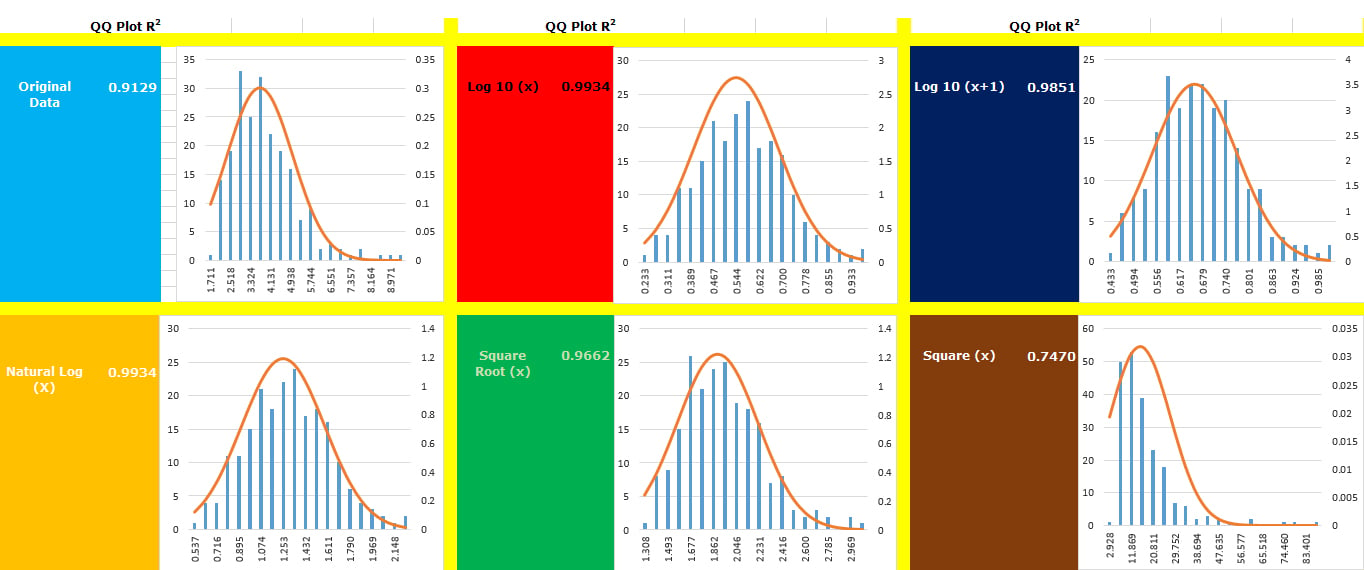
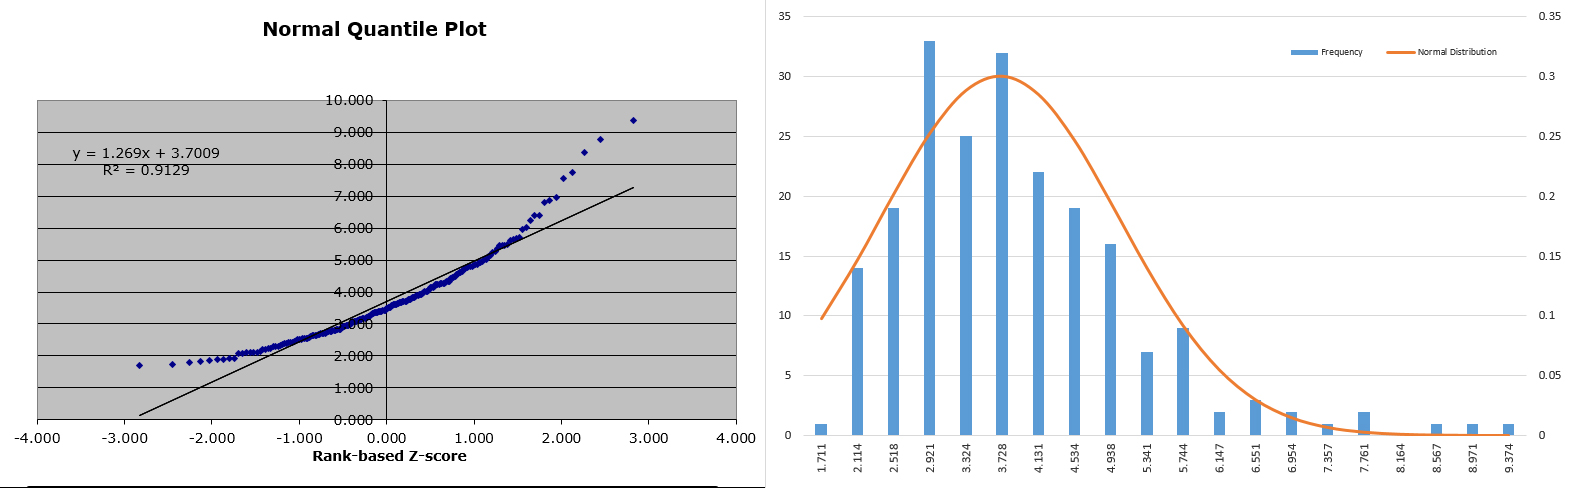
A related problem is that not all of the response variables that experimenters need to measure are normally distributed. A second workbook was developed to compare different transformations to normalize data. With the QPDOL.exe workbook, a researcher can enter (up to 300) observations and frequency distributions from the original data and 16 transformations are plotted. The transformations are from the classic paper by M.S. Bartlett, “The use of transformations.”
The QQ plots are also included for each transformation, and there are two extra spreadsheets should anyone want to add other transformations:
After choosing the best transformation to normalize the data, it is helpful to inverse transform the results for planning the next experiment. The ITSEPG.xls workbook was developed to present the transformed data in normal space to see how changing replications affects experimental power:
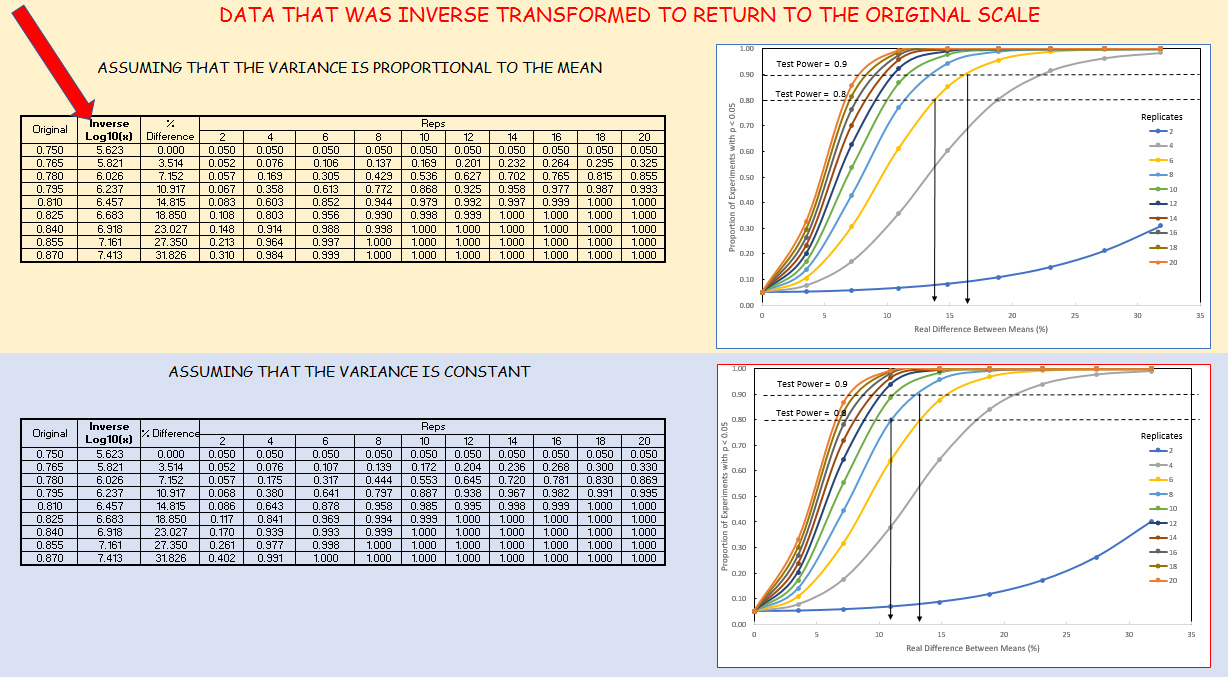
The Inverse Transformation Scale Experimental Power Graphing workbook results look much the same as those from EPGP.xls. ITSEPG.xls includes two graphs for each transformation. Sometimes the variance of populations is constant, regardless of the mean. Other times, as with growth, variation increases as the birds grow and larger birds are expected to be more variable than smaller ones.
The graphs and tables show there are some differences depending on the assumption about mean and variation, and they can give the researcher an indication of how important understanding the difference may be.
Other Resources to Help Understand and Determine Experimental Power
- UCLA Institute for Digital Research and Education: Introduction to power analysis
- Penn State: Eberly College of Science’s Statistics Online
- Statsoft statistical software
Cohen, J. (1988). Statistical power analysis for the behavioral sciences (2nd ed.). Routledge. https://doi.org/10.4324/9780203771587
Ellis, P. D. (2010). The essential guide to effect sizes: Statistical power, meta-analysis, and the interpretation of research results. Cambridge University Press. https://doi.org/10.1017/CBO9780511761676
McDonald, J. H. (2014). Handbook of biological statistics (3rd ed.). Sparky House Publishing.
Murphy, K. R., Myors, B., & Wolach, A. (2014) Statistical power analysis: A simple and general model for traditional and modern hypothesis tests (4th ed.). Routledge. https://doi.org/10.4324/9781315773155
References
Bartlett, M. S. (1947). The use of transformations. Biometrics, 3, 39–52. https://doi.org/10.2307/3001536
Wilk, M. B., & Gnanadesikan, R. (1968). Probability plotting methods for the analysis of data. Biometrika, 55, 1–17. https://doi.org/10.2307/2334448
Greenland, S. (2011). Null misinterpretation in statistical testing and its impact on health risk assessment. Preventive Medicine, 53, 225–228. https://doi.org/10.1016/j.ypmed.2011.08.010
Greenland, S. (2012). Nonsignificance plus high power does not imply support for the null over the alternative. Ann Epidemiol, 22, 364–368. https://doi.org/10.1016/j.annepidem.2012.02.007
Greenland, S., Senn, S. J., Rothman, K. J., Carlin, J. B., Poole, C., Goodman, S. N., & Altman, D. G. (2016). Statistical tests, P values, confidence intervals, and power: A guide to misinterpretations. Eur J Epidemiol, 31, 337–350. https://doi.org/10.1007/s10654-016-0149-3
Neyman, J. (1977). Frequentist probability and frequentist statistics. Synthese, 36, 97–131. https://doi.org/10.1007/BF00485695
Sheshkin, D.J. (2004). Handbook of Parametric and Nonparametric Statistical Procedures (3rd ed.). Chapman & Hall.
This package was originally prepared by Gene Pesti, Department of Poultry Science, University of Georgia; Dmitry Vedenov, Department of Agricultural Economics, Texas A&M University; Ricardo Nunes, Department of Agriculture, Universidade Estadual do Oeste do Parana; and Rashed Alhotan, Department of Animal Production, King Saud University.